
What’s in the News:
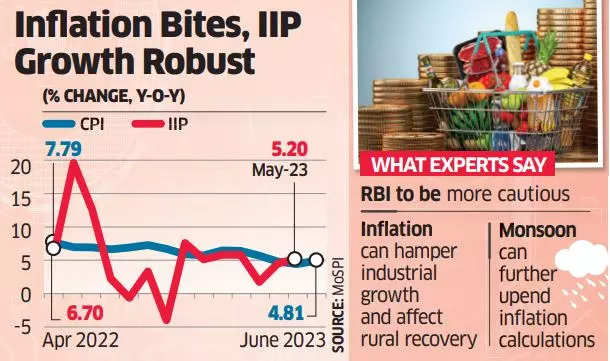
- India’s retail inflation experienced a surge of 4.81% in June, ending a four-month decline, as food prices increased due to uneven monsoon rains and supply disruptions.
- The Consumer Price Index (CPI)-based inflation was 4.31% in May, and food inflation rose to 4.49% in June.
- The Reserve Bank of India (RBI) is tasked with maintaining retail inflation within the range of 2% to 6% and will likely keep interest rates unchanged.
Reasons for Inflation Surge:
- Uneven monsoon rains damaged perishable food crops and hindered the movement of goods, leading to shortages of essential cooking ingredients like tomatoes, chillies, and onions.
- Food inflation, accounting for nearly half of the overall consumer price basket, increased to 4.49% from 2.96% in May.
- Vegetable prices rose by 12% on a month-on-month basis in June.
Key Points and Findings:
- The current inflation rate remains within the RBI’s comfort level of below 6%.
- The RBI considers the CPI while making monetary policy decisions, and the next policy review is scheduled for early next month.
- The RBI had previously projected retail inflation for the current fiscal year to average at 5.1% with June quarter inflation at 4.6%.
- India’s industrial production, measured by the Index of Industrial Production (IIP), increased to 5.2% in May, mainly due to growth in the manufacturing and mining sectors.
- Manufacturing output grew by 5.7% in May 2023 compared to 20.7% expansion in the previous year.
- Power generation rose by 0.9% in May, while mining output increased by 6.4%.
- The capital goods segment grew by 8.2% in May, while consumer durables output rose by 1.1%.
- Consumer non-durable goods output increased by 7.6%, and infrastructure/construction goods posted a growth of 14%.
- The output of primary goods grew by 3.5%, and intermediate goods output rose by 1.6% in May.
- During April-May period of fiscal year 2023-24, the growth in IIP was 4.8%, down from 12.9% in the corresponding period last year.
Retail Inflation vs. Wholesale Inflation in India:
| Retail Inflation | Wholesale Inflation | |
|---|---|---|
| Definition | The rate at which the general level of | The rate at which the wholesale prices of |
| prices for goods and services rises, | goods in bulk or at the wholesale level | |
| affecting the purchasing power of | increase or decrease over a given period | |
| consumers | ||
| Measurement | Consumer Price Index (CPI) | Wholesale Price Index (WPI) |
| Basket of Goods | Includes essential goods and services | Includes goods at the wholesale level, |
| purchased by consumers | excluding taxes and retail margins | |
| Components | Food, housing, transportation, healthcare, | Primary articles, fuel and power, |
| education, etc. | manufactured products | |
| Importance | Directly impacts consumers’ cost of | Provides insights into inflationary |
| living and purchasing power | pressures faced by producers and businesses | |
| Impact | Higher inflation reduces purchasing power | Higher wholesale inflation may lead to |
| and can affect economic growth increased costs for businesses and | ||
| potentially higher retail prices for goods | ||
| Policy Considerations | Central banks often use retail | Wholesale inflation data is used by the |
| inflation to guide monetary policy | government and policymakers to monitor | |
| decisions, such as interest rates | overall price trends and make informed | |
| decisions regarding economic policies |
Index of Industrial Production (IIP):
| Key Information | |
|---|---|
| Definition | An index that measures the |
| performance of various | |
| industrial sectors in the | |
| Indian economy | |
| Calculated by | Central Statistical |
| Organisation (CSO) | |
| Frequency | Monthly |
| Latest Update (May 2023) | IIP growth: 5.2% |
| Base Year | 2011-12 |
| Core Industries Represented | Eight core sectors |
| Core Industries (Weight in IIP) | |
| Coal | 10.33% |
| Electricity | 19.85% |
| Crude oil | 8.98% |
| Cement | 5.37% |
| Natural gas | 6.88% |
| Steel | 17.92% |
| Refinery products | 28.04% |
| Fertilizers | 2.63% |
| Total | 100% |
| Base Year Revisions | 9th revision since 1950 |
| First base year: 1937 | |
| Items Introduced (Examples) | Refined palm oil, surgical |
| accessories, cement clinkers | |
| Items Removed (Examples) | Chewing tobacco, toothbrush, |
| calculators, fans, watches, | |
| pens |
Find More News on Economy Here
![]()


 Weekly Current Affairs One Liners (06th ...
 Who is known as the Father of Scientific...
 What Is Vantara University? India’s Firs...