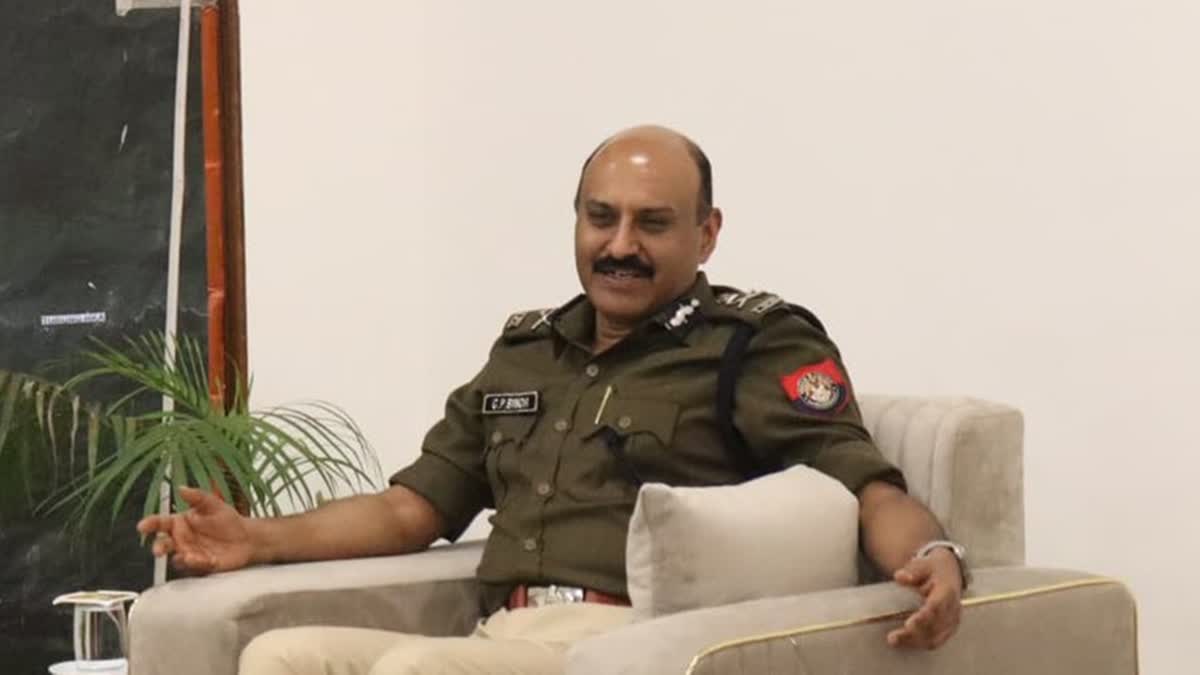
IndiGo Flight Disruptions Explained: FDTL Rules, Crew Shortages and DGCA Action

India’s largest airline, IndiGo, has witnessed widespread flight cancellations and delays, affecting thousands of travellers across several airports. The crisis stemmed from crew shortages triggered by stricter Flight Duty Time Limitation (FDTL) norms, whose final phase was implemented last month. IndiGo — managing over 60% of India’s domestic market — was unable to adjust operations smoothly, resulting in its punctuality collapsing to 19.7% on December 3, its worst performance registered in recent years.

Why IndiGo Was Hit Harder Than Other Airlines

Although the new FDTL norms apply across all carriers, IndiGo faced greater disruption due to its operating model and network size.

1. Massive Scale and High-Frequency Operations

With the largest fleet, busiest schedule, and highest number of daily departures, any staffing imbalance has a multiplied impact on IndiGo.

2. High Share of Late-Night and Early-Morning Flights

IndiGo dominates sectors most affected by the new fatigue-mitigation rules, especially night-time restrictions.

3. Intensive Crew and Aircraft Utilisation Strategy

IndiGo traditionally operates on a lean manpower model, extracting high utilisation from crew and aircraft.
When flying hours were reduced by regulation, IndiGo lacked staffing buffers to absorb the impact.

Why Other Airlines Are Less Affected

Competitors have:

  • Grounded aircraft awaiting retrofits
  • Delayed aircraft deliveries

This unintentionally left them with spare pilot capacity, making it easier to comply with FDTL norms.
Thus, other airlines had more crew per aircraft, providing flexibility that IndiGo lacked.

What the New FDTL Norms Changed

The revised norms introduced stronger fatigue-control mechanisms for pilots:

Weekly rest increased from 36 to 48 hours
Night landings capped at two (earlier six allowed)
Definition of night time extended by one hour

These reforms significantly tightened scheduling flexibility, especially for airlines with heavy night operations.

Implementation Timeline and Industry Pushback

Originally proposed for June 2024, the rollout was delayed due to objections raised by airlines, including IndiGo, which demanded:

  • More time
  • Additional crew hiring
  • Phased transition

The DGCA eventually enforced a two-phase rollout under Delhi High Court oversight:

  • Phase 1 (July): Increased weekly rest (IndiGo managed this)
  • Phase 2 (November): Night-time restrictions — this became IndiGo’s breaking point

Operational Domino Effect: Why Minor Delays Became a Meltdown

IndiGo primarily runs A320 and narrow-body operations, with each aircraft flying multiple legs daily.
If earlier delays push pilots beyond duty limits:

  • IndiGo must replace entire crew teams
  • Insufficient standby staff means gaps remain unfilled
  • Small disruptions snowball into mass cancellations

This structural fragility explains why IndiGo unravelled quicker than other carriers.

Scale of Disruptions and Declining Performance

  • 1,232 flights cancelled in November
  • On-time performance fell from 84.1% (Oct) → 67.7% (Nov)
  • December saw further deterioration as congestion, weather, and fatigue caps coincided

This marks a sharp fall for an airline once known for punctuality leadership.

IndiGo’s Official Explanation

IndiGo attributed disruptions to multiple operational stress points:

  • Winter schedule adjustments
  • Minor tech issues
  • Weather conditions
  • Rising airport congestion
  • Full rollout of FDTL norms

These compounded the crew shortages and network instability.

DGCA’s Response and Corrective Actions

The aviation regulator has directed IndiGo to:

1. Strengthen Crew Planning

Fine-tune rostering to align with new fatigue rules.

2. Improve Airport and ATC Coordination

Enhance communication channels to reduce preventable bottlenecks.

3. Enhance Turnaround & Disruption Management

Speed up ground handling and response mechanisms to cascading delays.

These steps aim to restore operational discipline without violating safety norms.

Pilot Groups Blame IndiGo’s Management Strategy

Pilot associations have criticised IndiGo, alleging:

  • Hiring freezes despite two years’ notice
  • Non-poaching agreements restricting talent mobility
  • Pay stagnation
  • Chronic understaffing in operations

They argue IndiGo failed to prepare for predictable regulatory change and may now be using disruptions to pressure DGCA into diluting fatigue rules.

Broader Industry Implications

The IndiGo episode reveals structural challenges in Indian aviation:

  • High dependence on lean manpower
  • Safety reforms clashing with commercial utilisation practices
  • Weather, airspace congestion, and crew fatigue combining into systemic risk

The crisis underscores the importance of fatigue-based safety norms in a fast-growing aviation ecosystem.

NITI Aayog & IBM Unveil Roadmap to Make India a Top‑3 Quantum Economy by 2047

The world is entering a new technological era — one where quantum computing, quantum communication and quantum sensing may redefine industries, security, and innovation globally. India — with its large talent pool, growing tech sector, and rising ambitions — does not intend to be left behind. Recognising the stakes, NITI Aayog’s Frontier Tech Hub, in collaboration with IBM, has unveiled a comprehensive roadmap that seeks to make India one of the top three quantum economies in the world by 2047.

What the Roadmap Aims to Do

The newly launched roadmap sets forth bold but clear goals,

  • Build indigenous quantum hardware and software capabilities rather than remain dependent on imports.
  • Foster the emergence of globally competitive quantum companies and startups — at least ten such firms are expected to flourish under this plan.
  • Enable India to capture a sizable share of the global quantum software and services market.
  • Apply quantum technologies across critical sectors such as defence, energy, healthcare, logistics, finance, thereby boosting national security, efficiency, and innovation.
  • Leverage the existing National Quantum Mission (NQM) as the backbone — combining government funding, research, private‑sector innovation and policy support to build a full quantum‑ready ecosystem.

Background: India’s Quantum Push and NQM

India’s quantum aspirations are not new. In April 2023, the Union Cabinet approved the National Quantum Mission (NQM), with a sanctioned budget of ₹6,003.65 crore (2023–24 to 2030–31). The aim: to catalyze research and industrial development in quantum computing, communication, sensing, materials, and devices.

Under this mission, the government plans to set up thematic research hubs (T‑Hubs) and funding for start‑ups, encourage academic–industry collaboration, and develop infrastructure for quantum technologies. The NITI roadmap builds on this foundation — aiming not just for research, but large‑scale commercialization and global competitiveness.

Key Components of the Roadmap

The roadmap identifies several actionable pathways and focus areas necessary to achieve the 2047 vision.

1. R&D and Infrastructure Build‑Up: Expand and deepen research in quantum hardware (qubit systems, processors), quantum communication (secure networks, quantum key distribution), quantum sensing & metrology, and quantum materials & devices.

2. Talent, Skills and Start‑ups: Encourage the growth of quantum‑focused start‑ups, promote skill development at universities and research institutions, and build a strong talent pipeline. This helps ensure that the human resource for quantum research and industry remains robust.

3. Sectoral Application & Adoption: Quantum technologies will be deployed across critical sectors — from defence and cybersecurity to healthcare (like drug discovery, diagnostics), energy systems, logistics optimisation, financial services, and material science — turning quantum research into real‑world impact.

4. Public–Private Collaboration: The roadmap emphasizes partnership among policymakers, academia, industry, investors, and state governments to build a “collective ownership” model for quantum economy growth.

5. Ecosystem & Regulatory Support: Establishing standards, governance, and regulatory frameworks for quantum technologies; ensuring secure quantum‑safe cryptography; providing incentives for private investments; and enabling smooth commercialisation of quantum products and services.

Significance: What This Could Mean for India

If implemented successfully, this roadmap could transform India’s technological and economic landscape in several ways,

  • Global leadership in quantum technologies: Becoming a top‑3 quantum economy would position India alongside nations currently leading in quantum research and deployment.
  • Boost to innovation and high‑tech industry: From quantum software firms to hardware manufacturers and services, there would likely be a surge in high‑value tech startups and jobs.
  • Strategic & security advantages: Quantum security and quantum communication systems can strengthen India’s cyber‑security and defence readiness.
  • Advancement in critical sectors: Quantum‑enabled improvements in healthcare, energy, logistics, materials — potentially leading to breakthroughs in diagnostics, resource management, and more efficient infrastructure.

Economic growth & competitiveness: By entering global quantum markets early, India could attract investments, become an export hub for quantum services, and reduce reliance on foreign technology.

Key Takeaways

  • The roadmap aims to make India a top‑3 quantum economy by 2047 via quantum computing, communication, sensing, materials and services.
  • It builds on the existing National Quantum Mission (NQM), which was approved in April 2023 with a ₹6,003.65 crore budget for 2023–24 to 2030–31.
  • Core components: domestic quantum hardware & software development, start‑ups, skill building, sectoral deployment (defence, healthcare, energy, logistics, finance), public‑private‑academic collaboration.

Weak La Niña Likely to Influence Global Weather in Winter 2025–26: WMO Predicts

The World Meteorological Organization (WMO) has issued its latest ENSO (El Niño–Southern Oscillation) Update, predicting a 55% chance of weak La Niña conditions developing during the December 2025 to February 2026 period. While La Niña is often associated with global cooling, the WMO notes that many regions will still experience above-average temperatures, a clear sign of ongoing global warming influencing traditional weather patterns.

What is La Niña?

La Niña is a naturally occurring climate phenomenon marked by a large-scale cooling of sea surface temperatures in the central and eastern Pacific Ocean. It is typically accompanied by shifts in atmospheric circulation, including changes in wind patterns, pressure systems, and rainfall distribution across the tropics and subtropics.

La Niña events can have wide-ranging effects on global weather,

  • Drier conditions in parts of the Americas and East Africa
  • Heavier rainfall in Southeast Asia, Australia, and parts of southern Africa
  • Cooler temperatures in the Pacific but warmer weather in other regions due to overriding climate trends

ENSO Outlook: December 2025 – February 2026

According to the WMO’s Global Producing Centres for Seasonal Prediction,

  • As of mid-November 2025, borderline La Niña conditions have been observed.
  • There is a 55% chance that La Niña thresholds will be crossed in the December–February season.

The likelihood of ENSO-neutral conditions rises steadily in the following months,

  • 65% chance for January–March 2026
  • 75% chance for February–April 2026
  • There is 0% chance of El Niño development during this period.

This weak La Niña is not expected to produce the extreme disruptions associated with stronger events, but its moderate rainfall and temperature effects will still be significant for climate-sensitive sectors.

Warmer Winter Despite La Niña

Interestingly, despite La Niña’s typical cooling influence, the WMO forecasts above-normal temperatures for much of the Northern Hemisphere and parts of the Southern Hemisphere between December 2025 and February 2026. This is largely attributed to climate change, which continues to raise global average temperatures, altering the outcomes of even well-understood climate cycles.

Rainfall patterns during this period are expected to mimic past weak La Niña years, with certain regions experiencing wetter-than-normal and others facing drier-than-average conditions. However, many areas will likely fall into the “near-normal” category, with probabilistic models suggesting no extreme shifts for most landmasses.

Why These Forecasts Matter

According to WMO Secretary-General Celeste Saulo, these seasonal climate forecasts are crucial for,

  • Agriculture: Helping farmers plan crop cycles and manage irrigation.
  • Health: Predicting vector-borne disease outbreaks linked to rainfall patterns.
  • Transport and energy: Preparing for potential disruptions and demand shifts.
  • Humanitarian planning: Mitigating food insecurity or disaster risks in vulnerable regions.

Such data are part of WMO’s climate intelligence efforts, which are increasingly used to save lives and prevent economic losses in a warming world.

Climate Variability in a Changing World

The WMO emphasized that natural cycles like La Niña now occur against the backdrop of long-term climate change, amplifying or offsetting their traditional impacts. Other climate factors—such as the North Atlantic Oscillation, Arctic Oscillation, and Indian Ocean Dipole—are also monitored to provide a fuller seasonal picture through WMO’s Global Seasonal Climate Updates (GSCU).

This comprehensive approach helps governments and sectors adapt to increasingly complex climate realities.

IFFCO-TOKIO Partners with Cooperatives to Expand Micro Insurance Access for Underserved Communities

Marking its 25th anniversary, IFFCO-TOKIO General Insurance Company (GIC) announced a new initiative aimed at enhancing insurance accessibility in India’s under-covered communities. Inspired by the Insurance Regulatory and Development Authority of India (IRDAI)’s vision of ‘Insurance for All by 2047’, the company has partnered with multiple cooperative societies to distribute micro insurance packages.

A Joint Venture with a Social Mission

Established in 2000, IFFCO-TOKIO GIC is a 51:49 joint venture between the Indian Farmers Fertilizer Cooperative (IFFCO) and Japan’s Tokio Marine Group. Since inception, it has been driven by the principle of affordable insurance, a mission that now expands to align with India’s socioeconomic growth and the evolving aspirations of its people.

Subrata Mondal, Managing Director and CEO, stated, “While at the beginning we were guided by the principle of affordable insurance, the vision has now expanded to align with people’s aspirations and a robust economy, while remaining committed to IRDAI’s vision for 2047.”

Micro Insurance: Expanding Protection at the Grassroots

Micro insurance refers to low-cost insurance products tailored for low-income individuals or small-scale businesses, typically covering health, accident, life, motor, or property risks. These policies have lower premiums and simplified claim procedures, making them accessible and practical for rural and informal sector workers.

IFFCO-TOKIO’s new initiative involves working through cooperative societies, which already have deep community networks. This distribution model allows for better awareness, trust, and reach in semi-urban and rural regions.

The company’s micro insurance packages will include,

  • Health insurance for primary medical needs
  • Motor insurance for two-wheelers and rural transport vehicles
  • Personal accident cover
  • Package policies combining multiple coverages at minimal cost

IRDAI’s Push: Insurance for All by 2047

The IRDAI’s ‘Insurance for All by 2047’ goal envisions every Indian having access to at least basic life, health, and property insurance by the time the country marks 100 years of independence.

IFFCO-TOKIO’s alignment with this mission signifies how private players can contribute to financial inclusion and social security—by bridging the urban-rural divide in insurance penetration.

The micro insurance market is a crucial piece of this puzzle. According to IRDAI data, despite rising awareness, India’s insurance penetration remains around 4% of GDP, far below global averages. Greater push in rural and semi-urban markets is essential to boost resilience against financial shocks like illness, accidents, or crop failures.

Key Takeaways

  • IFFCO-TOKIO GIC, a 51:49 joint venture between IFFCO and Tokio Marine Group, launched in 2000.
  • Celebrated its 25th anniversary in 2025, also called silver jubilee year.
  • Tied up with cooperatives to distribute micro insurance to under-served groups.
  • Supports IRDAI’s ‘Insurance for All by 2047’ vision.
  • Products include health, motor, personal accident, and package policies.
  • Focus on affordability, simplified claims, and cooperative-led distribution in rural India.

Runway’s Gen-4.5 Surpasses OpenAI and Google in Text-to-Video AI Race

New York-based AI company Runway has launched Gen-4.5, its most advanced text-to-video generation model to date, claiming top spot globally in video AI. According to the company’s announcement on December 4, 2025, Gen-4.5 is now rated higher than OpenAI’s Sora 2 and Google’s Veo 3, setting new standards in visual realism, physics accuracy, and creative control. Runway, which first made waves with its Gen-1 model in 2023, continues to push the boundaries of video generation with this latest iteration.

What Makes Gen-4.5 Stand Out?

The Gen-4.5 model is capable of creating videos with unmatched physical realism and cinematic quality, offering users granular control over motion, detail, and style.

It supports a broad spectrum of aesthetics — from photorealistic animation to Hollywood-style cinematic visuals — while maintaining high temporal consistency (i.e., smooth movement across video frames).

In benchmark tests, Gen-4.5 scored 1247 points in the Elo benchmark, edging out,

  • Google’s Veo 3 (1226)
  • OpenAI’s Sora 2 Pro (1206)

It was developed in collaboration with Nvidia and trained using the latest Blackwell and Hopper GPUs, allowing for efficient training and fast inference (video rendering).

Key Features of Gen-4.5

  • Temporal Consistency: Maintains realistic frame-by-frame continuity in object motion, liquid flow, hair strand movement, and material dynamics.
  • Controllable Action Generation: Users can input specific prompts for movements, scenes, or styles, allowing for directorial control over generated content.
  • Photorealism with Speed: Despite generating highly detailed videos, Gen-4.5 doesn’t compromise on speed — it retains the performance efficiency of its predecessor, Gen-4.
  • Creative Flexibility: Ideal for creators, designers, and filmmakers, the model supports a variety of applications from short films to design mockups, all from text prompts.

Limitations Still Persist

  • Causality and Object Permanence: Gen-4.5 struggles with maintaining logical sequence of events in dynamic scenes, such as cause-effect relationships in actions.
  • Success Bias: It may sometimes render idealized or incorrect outcomes — for instance, showing an arrow hitting the target despite being poorly aimed.
  • Runway acknowledged these issues, stating they are part of the broader challenge of building reliable “world models” in AI. Continued iteration is expected to address these gaps.

Accessibility and Use

  • Gen-4.5 is available across all subscription plans, making it more accessible to individual creators, studios, and enterprises.
  • The model is designed to function seamlessly in commercial, educational, and creative environments where video generation from text can save time and expand visual storytelling.

Key Takeaways

  • Runway’s Gen-4.5 outperforms Google’s Veo 3 and OpenAI’s Sora 2 Pro in text-to-video benchmarks.
  • Elo benchmark score: Gen-4.5 (1247), Veo 3 (1226), Sora 2 Pro (1206).
  • Offers unprecedented realism, temporal consistency, and style flexibility.
  • Built with Nvidia GPUs (Blackwell and Hopper), enabling high performance and speed.
  • Limitations include causality errors and success bias.
  • Available across all subscription plans, accessible to a wide range of creators.

Keoladeo National Park: Location, Biodiversity, Migratory Birds and Conservation Importance

Following good monsoon rains, migratory birds like storks, pelicans, painted storks, and bar-headed geese have returned to Keoladeo National Park — signalling ecological revival in one of India’s most iconic wetlands. Known globally as a bird-watcher’s paradise, Keoladeo plays a key role in wetland conservation, winter migration, and ecological research.

About Keoladeo National Park

Keoladeo National Park is located in the Bharatpur district of Rajasthan, originally known as the Bharatpur Bird Sanctuary.

Historical Background

  • Founded in the late 19th century as a hunting reserve by Maharaja Suraj Mal of Bharatpur.
  • Declared a bird sanctuary in 1956.
  • Upgraded to national park status in 1981.
  • Renamed Keoladeo after an ancient Shiva temple located inside the park.

Area & Protection

  • Covers 29 sq km.
  • Unique among Indian parks — it is entirely enclosed by a 2-metre boundary wall to prevent encroachments.

Conservation Importance

Keoladeo is recognised globally because it:

  • Is one of the world’s most important bird breeding and feeding habitats
  • Is designated both a Ramsar Wetland Site and a UNESCO World Heritage Site

These honours highlight its role in global biodiversity conservation, wetland protection, and migratory bird survival.

Geography and Vegetation

Keoladeo has a diverse mixture of wetland systems:

  • Woodlands
  • Swamps
  • Wet grasslands

Its vegetation is mostly dry deciduous, consisting of:

  • Medium-sized trees
  • Shrubs and scrub varieties

Common Plant Species

Some frequently spotted trees include:

  • Kadam
  • Jamun
  • Babul
  • Kandi
  • Ber
  • Kair
  • Piloo

This mosaic ecosystem sustains varied herbivores, reptiles, and bird life.

Fauna Richness

Keoladeo’s biodiversity is not limited to birds.

Mammals

  • Deer
  • Sambars
  • Blackbucks
  • Jackals
  • Fishing cats

Reptiles

  • Pythons
  • Monitor lizards
  • Snakes and amphibians

Migratory Pathway Significance

Keoladeo lies along the Central Asian migratory flyway, one of the world’s major bird migration routes.
This makes it a crucial staging and wintering ground.

Bird Population & Migration

  • Home to over 360 species of resident and migratory birds.
  • Peak migration season: October to March.
  • Visitors arrive from Afghanistan, Turkmenistan, China, and Siberia.

Important Winter Migrant Species

  • Gadwalls
  • Shovellers
  • Common teals
  • Tufted ducks
  • Pintails
  • White spoonbills
  • Asian open-billed storks
  • Oriental ibises
  • Rare Siberian cranes (once a major attraction)

Keoladeo as an Ecological Classroom

The park is an unparalleled site for:

Wildlife photography
Ecotourism
Research and breeding studies
International bird watching tourism

Its wetland dynamics help scientists study migration patterns, climate impact, and wetland ecology.

National Forensic Infrastructure Enhancement Scheme (NFIES): Objectives, Components and Latest Updates

With rising crime complexity and new legal mandates requiring forensic evidence, India is strengthening its forensic ecosystem. To address these challenges, the government launched the National Forensic Infrastructure Enhancement Scheme (NFIES), aimed at building state-of-the-art laboratories and trained manpower.

What is the National Forensic Infrastructure Enhancement Scheme?

The NFIES is a Central Sector Scheme launched in 2024 to build robust forensic capabilities across India.

Implementation Period

2024–25 to 2028–29

Nodal Ministry

Ministry of Home Affairs

Aim of the Scheme

The scheme’s primary aim is to:

  • Create strong forensic laboratory infrastructure, and
  • Develop world-class trained forensic professionals to support investigation and justice delivery.

This move aligns with India’s growing focus on evidence-based policing and high conviction rates.

Why Was NFIES Launched?

The scheme was introduced due to major structural gaps in India’s forensic ecosystem:

1. New Criminal Laws Mandate Forensic Use

India’s newer criminal laws require forensic investigation for offences where punishment is seven years or more, sharply increasing laboratory workload.

2. Rising Case Pendency

Forensic laboratories face large backlogs, delaying investigations and trials.

3. Manpower Shortages

Most Forensic Science Laboratories (FSLs) lack sufficient trained personnel.

4. Conviction Rate Goal

NFIES supports the government’s target to achieve a conviction rate exceeding 90%, which requires reliable, scientific evidence.

Components of the NFIES Scheme

The scheme has three major components, each aimed at expanding forensic access and expertise:

1. Setting Up NFSU Campuses

  • Establishing new campuses of the National Forensic Sciences University (NFSU) across the country.
  • These campuses will produce skilled forensic scientists, analysts, and investigators.

2. Establishing Central Forensic Science Laboratories (CFSLs)

  • New CFSL facilities will be created to expand investigative capacity.
  • They will support national-level forensic examinations, cyber forensics, DNA analysis, and digital evidence.

3. Strengthening Existing Infrastructure

  • The Delhi campus of NFSU will receive infrastructure enhancement for advanced training, research, and testing facilities.

Significance of the Scheme

NFIES is vital for improving India’s criminal justice system in multiple ways:

Faster Forensic Processing

By expanding lab capacity, it reduces case backlog and pendency.

Trained Workforce

Developing skilled forensic technicians and experts ensures credible evidence handling.

Better Investigation Quality

Courts rely increasingly on scientific proof — NFIES enhances accuracy, reliability, and admissibility of evidence.

Higher Conviction Rates

Better forensic support strengthens prosecution, helping achieve the target of 90%+ conviction rate.

National Security & Modern Policing

As cybercrime, terrorism cases, and digital fraud rise, advanced forensic systems become essential.

Fiscal Policy in India: Objectives, Instruments, Types and Role in Governance

Fiscal Policy is one of the most influential pillars of India’s economic strategy. It determines how the government spends, raises money, and borrows to guide the economy toward development and stability. In a country like India, where large populations depend on public services and markets are vulnerable to shocks, fiscal policy helps correct imbalances, support growth, reduce poverty, and promote equity.

What is Fiscal Policy in India?

Fiscal Policy refers to government actions related to taxation, expenditure, and borrowing that influence economic activity.
Its intellectual foundation lies in Keynesian economics, which suggests that the government must intervene when markets fail:

  • During recessions → increase spending or reduce taxes to boost demand
  • During inflation periods → cut spending or increase taxes to reduce overheating

Thus, fiscal policy functions as both a growth engine and an economic shock absorber.

Core Objectives of Fiscal Policy

India’s fiscal objectives balance long-term development with short-term macroeconomic stability. Major aims include:

Resource Mobilisation

Generating funds for infrastructure, health, education, and social security.

Economic Stability

Reducing fluctuations in output, unemployment, and inflation.

Price Stability

Using expenditure and taxation to curb inflation or deflation pressures.

Sustained Growth

Ensuring growth that is consistent, inclusive, and sustainable over time.

Improving Living Standards

Investing in welfare schemes, employment programmes, and public services.

Reducing Inequality

Implementing progressive taxation and redistribution.

Boosting Private Sector Activity

Providing incentives for investment, innovation and entrepreneurship.

External Balance

Reducing high foreign dependence and strengthening the balance of payments.

Instruments of Fiscal Policy

India uses three primary instruments, supported by supplementary methods:

Public Expenditure

This includes spending on:

  • Infrastructure
  • Energy
  • Defence
  • Health
  • Education
  • Welfare schemes

Changes in expenditure directly affect employment, production, and demand.
For example, increased capital spending on railways or rural roads generates jobs, stimulates private investment, and boosts income growth.

Taxation

Taxes determine how much income and profit individuals and firms retain.

  • Lower taxes increase disposable income → higher consumption and investment
  • Higher taxes reduce excess demand → help control inflation

India uses both direct taxes (income tax) and indirect taxes (GST) to influence economic activity.

Public Borrowing

When revenue is insufficient, the government borrows from:

  • Banks
  • Citizens
  • Foreign institutions

Borrowing finances deficits, welfare schemes, and infrastructure, but excessive borrowing can increase debt burden and future interest costs.

Supplementary Measures

Fiscal policy may also use:

  • Export incentives
  • Subsidy reforms
  • Price controls
  • Welfare transfers
  • Consumption duties

These fine-tune policy impact and correct market distortions.

Fiscal Policy vs Monetary Policy

Although interconnected, both policies differ:

Fiscal Policy Monetary Policy
Managed by the Government Managed by RBI
Focuses on spending, taxes, borrowing Focuses on money supply, interest rates
Stimulates demand and promotes growth Controls inflation and liquidity

Both sectors work together — fiscal policy boosts demand and investment while monetary policy ensures price stability and financial discipline.

Types of Fiscal Policy in India

Based on economic conditions, India adopts different approaches:

Expansionary Fiscal Policy

  • Higher spending and/or lower taxes
  • Used during recessions
  • Aims to increase employment and GDP growth
  • Risk: inflation

Contractionary Fiscal Policy

  • Reduced spending and/or higher taxes
  • Used when inflation is rising
  • Aims to cool overheating and reduce deficit
  • Risk: short-term unemployment

Neutral Fiscal Policy

  • Revenue equals expenditure
  • Used in stable growth conditions
  • Aims to maintain equilibrium

Cyclical Nature of Fiscal Policy

Fiscal policy is shaped by the economic cycle:

Counter-Cyclical Fiscal Policy

Moves against the business cycle:

  • More spending during downturns
  • Less spending during booms

Example: India’s COVID-19 and 2008 crisis stimulus packages.

Pro-Cyclical Fiscal Policy

Moves with the business cycle:

  • More spending during booms
  • Austerity during recessions

This approach can worsen inequality and weaken recovery, therefore less preferred.

Key Concepts Linked to Fiscal Policy

Fiscal Deficit

Gap between spending and non-borrowed revenue, expressed as % of GDP.
A large deficit indicates higher borrowing needs.

Fiscal Consolidation

Efforts to reduce deficit through prudent spending and improved revenue.
India institutionalises this through the FRBM Act.

Fiscal Drag

When rising income pushes taxpayers into higher tax brackets without real income gain, reducing disposable income.

Fiscal Neutrality

Taxing and spending decisions cancel each other out → no net demand impact.

Crowding-Out Effect

Heavy government borrowing pushes up interest rates, making private investment more expensive and reducing its share.

Pump Priming

Government boosts economic activity through spending and incentives to jump-start growth — seen in efforts during major downturns.

Economic Stimulus

A broad framework of fiscal and/or monetary measures to revive demand and employment.
Example: Atma Nirbhar Bharat Package during the pandemic.

Which is the Coldest Place on the Earth? Check the Name and Significance

The Earth has many amazing and unusual places, and some of them experience temperatures that are far colder than anything we feel in daily life. These extremely cold regions remain frozen throughout the year and are known for their harsh weather, powerful winds, and thick ice. Scientists study these areas to understand how our planet works and how climate changes over time.

Coldest Place on Earth

The coldest place ever recorded on Earth is Vostok Station, a remote research base in Antarctica. This Russian station once measured a freezing temperature of –89.2°C (–128.6°F) on July 21, 1983. It sits high on the Antarctic Plateau, surrounded by thick ice and strong winds. Because of its height and location, Vostok Station experiences extremely cold weather throughout the year.

Why Vostok Station is So Important?

Vostok Station is not just known for cold temperatures. It is also a major center for scientific study. The station lies on ice that is more than 4 kilometers thick, and its height is around 4,000 meters above sea level. Scientists drill deep into the ice to collect ancient ice cores. These samples help them learn how Earth’s climate changed over hundreds of thousands of years.

More than Just a Frozen Land

Working at Vostok Station is very challenging. The extreme cold makes it hard to use machines, conduct experiments, or even move around safely. Researchers must wear special clothing and use strong, protected equipment. Despite these difficulties, the station plays a huge role in helping scientists understand global warming and future climate trends.

Other Places that Face Extreme Cold

Even though Vostok Station holds the record, there are several other places that are also extremely cold.

  • Denali, Alaska: Denali, the highest peak in North America, has recorded temperatures as low as –83°C at its summit. Climbers often face dangerous winds, heavy snowfall, and freezing conditions.
  • Oymyakon, Russia: Oymyakon is the coldest inhabited place on Earth. Winters often stay around –50°C, and the lowest recorded temperature is –67.7°C. People here show amazing strength and adapt to life in such harsh weather.
  • Verkhoyansk, Russia: Another Siberian town, Verkhoyansk, is also known for its extreme winters. Average temperatures in the coldest months drop to –45°C, making daily life very challenging.

The Eastern Antarctic Plateau

Scientists believe that certain parts of the Eastern Antarctic Plateau may get even colder than Vostok Station. Satellite data suggests temperatures could fall as low as –94°C, and on the ground possibly near –98°C. These findings show just how severe and extreme Antarctica’s climate can be.

What these Cold Places Teach Us?

The coldest places on Earth are not just interesting facts—they are key to understanding our planet. The ice, climate patterns, and weather changes seen in these regions help scientists study global warming and predict future environmental changes.

Billionaire Wealth Transfer Enters Historic Phase

In a striking reflection of a shifting global wealth landscape, the UBS Billionaire Ambitions Report 2025 has revealed that the world is witnessing the largest billionaire wealth transfer on record. In the 12 months leading up to April 2025, 91 individuals became billionaires by inheritance, receiving a combined $298 billion—an increase of over one-third from 2024. This marks the most significant wealth handover since UBS began tracking billionaire data in 2015, underscoring a generational shift that is reshaping global finance, family business, and wealth management.

A Multi-Year Trend Intensifies

  • According to UBS executive Benjamin Cavalli, this surge in billionaire inheritance is not a one-time event but part of a “multi-year wealth transfer that’s intensifying.”
  • UBS, which compiled the report based on data from 47 global markets, estimates that a staggering $5.9 trillion will be passed down to billionaire heirs over the next 15 years.
  • The pattern reflects the aging of the first wave of global billionaires, many of whom built empires during the late 20th century, and are now beginning to hand over control to spouses, children, or designated successors.

Leading Countries in Wealth Handover

While this is a global phenomenon, the United States is projected to remain the epicenter of billionaire inheritance. Other major contributors to this intergenerational wealth shift include,

  • India
  • France
  • Germany
  • Switzerland

The report also emphasizes that billionaires are increasingly mobile, especially younger heirs who are more likely to relocate based on quality of life, tax advantages, and geopolitical stability.

Billionaires on the Move: The Mobility Factor

As wealth changes hands, location matters more than ever. The UBS report notes that jurisdictions with favorable tax regimes and political stability are increasingly becoming magnets for the super-rich. Among the top destinations,

  • Switzerland
  • United Arab Emirates (UAE)
  • United States
  • Singapore

This trend is closely tied to inheritance tax policies, quality of education and healthcare, and personal safety—factors that weigh heavily on billionaire families’ relocation decisions.

What This Means for Global Inequality and Economy

This unprecedented transfer of ultra-high-net-worth assets brings up complex policy and economic questions,

  • How will inherited wealth be invested or preserved?
  • What role will next-generation billionaires play in philanthropy, business leadership, or political influence?
  • Can governments create effective taxation systems without prompting capital flight?

For developing economies like India, the growing presence of second-generation billionaires opens both opportunities and risks. On one hand, it could lead to increased entrepreneurial activity, but it could also deepen wealth concentration if not accompanied by progressive policies.

Key Takeaways

  • $298 billion inherited by 91 new billionaires in the 12 months to April 2025.
  • Highest ever since UBS began tracking data in 2015.
  • $5.9 trillion set to be transferred globally over the next 15 years.
  • Leading countries: USA, India, France, Germany, Switzerland.
  • Swiss voters rejected 50% inheritance tax, reinforcing its status as a billionaire-friendly nation.
  • Mobility of billionaires driven by tax, lifestyle, and political stability.
IndiGo Flight Disruptions Explained: FDTL Rules, Crew Shortages and DGCA Action_13.1
December 2025
M T W T F S S
1234567
891011121314
15161718192021
22232425262728
293031