
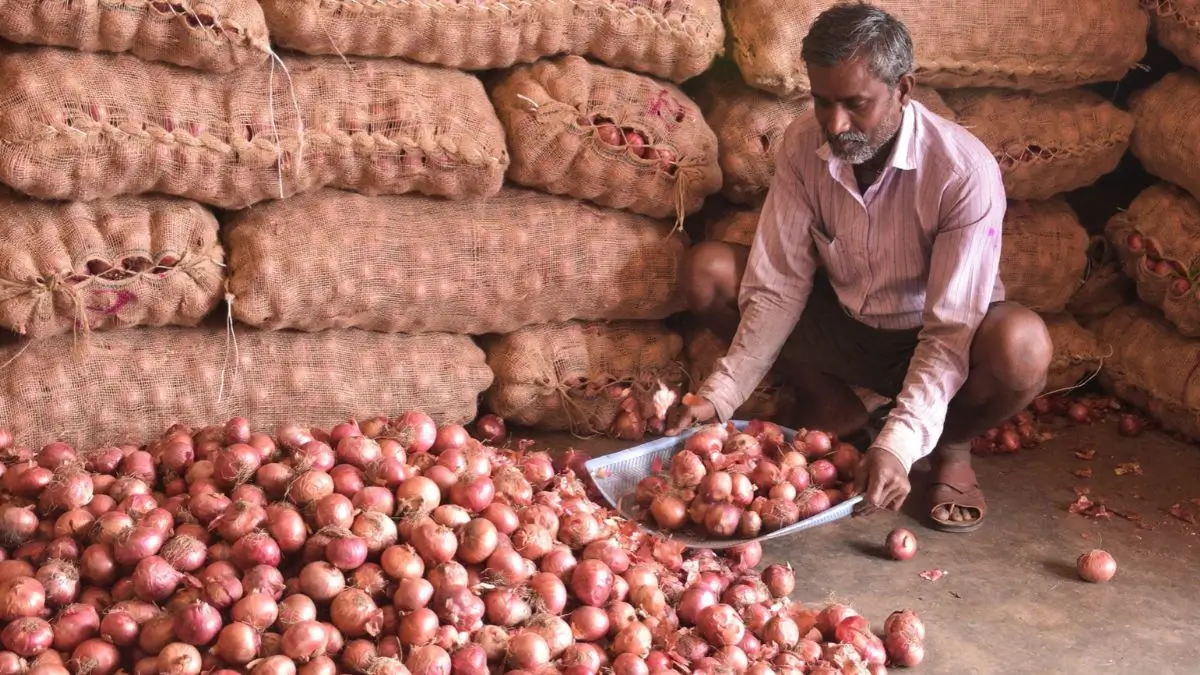
India’s retail inflation rise to 6.09% in October 2026 from 5.54% in September, according to provisional Consumer Price Index (CPI) data released by the Ministry of Statistics and Programme Implementation (MoSPI). Additionally, food inflation was recorded at 8.94% up from 7.74%. Rural inflation continued to be higher than inflation in urban areas. There was also a sharp rise in inflation for onions as they saw the highest inflation at an item level.
The following numbers have been confirmed by the official MoSPI release. Tamil Nadu (7.29%) and Telangana (7.26%) saw some of the highest inflation of any states/UTs and Mizoram saw the lowest inflation (2.85%), not Delhi. The information below is taken from the official list of inflation at a state level.
Retail Inflation (Oct 2026)
The overall CPI-based retail inflation figure rose by 0.55 percentage points to 6.09% from 5.54%. Food inflation rose by 1.20 percentage points.
| Indicator | September 2026 | October 2026 |
| Overall Retail Inflation | 5.54% | 6.09% |
| Overall Food Inflation | 7.74% | 8.94% |
| Rural Retail Inflation | 6.08% | 6.63% |
| Urban Retail Inflation | 4.88% | 5.41% |
| Rural Food Inflation | 8.06% | 9.09% |
| Urban Food Inflation | 7.18% | 8.68% |
| Overall CPI Index | 109.49 | 110.05 |
Rural inflation was higher than urban inflation.
Highest Inflation at an Item Level
The highest year-on-year inflation for individual items was seen for onions, rising sharply to 116.22% in October 2026. Garlic followed closely behind at 60.74%.
| Item | September 2026 | October 2026 |
| Onions | 108.13% | 116.22% |
| Garlic | 54.62% | 60.74% |
| Silver Jewellery | 87.82% | 52.39% |
| Ginger | 62.85% | 48.32% |
| Lemons | 36.41% | 47.30% |
lowest Inflation at an Item Level
| Item | October 2026 |
| Potatoes | -14.24% |
| Cauliflower | -10.57% |
| Coconuts | -5.60% |
| Purple Eggplants (Brinjals) | -3.34% |
| Cabbage | -1.92% |
Prices for these items were lower than they were for this month last year.
Highest Inflation at a Major Group Level:
The highest inflation was seen for Personal care, social protection and miscellaneous goods and services at 10.14%. This was followed by Restaurants and accommodation services at 10.06%.
| Group | Inflation (October 2026) |
| Personal care, social protection and miscellaneous goods and services | 10.14% |
| Restaurants and accommodation services | 10.06% |
| Food and non-alcoholic beverages | 8.51% |
| Transport | 5.84% |
| Clothing and Footwear | 4.96% |
| Paan, tobacco and intoxicants | 4.93% |
| Education services | 4.02% |
| Furnishings, Household Equipment and Routine Maintenance of House | 3.94% |
| Information and Communication | 3.16% |
| Housing, Water, Electricity, Gas and Other Fuels | 2.90% |
| Recreation, Sport and Culture | 2.52% |
| Health | 2.05% |
Note: Food and non-alcoholic beverages had an inflation rate of 8.51%, whilst the CFPI shows inflation for food items at 8.94%.
Highest Inflation at a State Level
Puducherry had the highest overall retail inflation at 7.96%. Dadra and Nagar Haveli and Daman and Diu saw the second highest inflation at 7.59%.
States/UTs with Highest Inflation
| State/UT | Overall Inflation |
| Puducherry | 7.96% |
| Dadra and Nagar Haveli and Daman and Diu | 7.59% |
| Tamil Nadu | 7.29% |
| Telangana | 7.26% |
| Andhra Pradesh | 7.25% |
| Madhya Pradesh | 7.19% |
| Odisha | 7.17% |
| Karnataka | 7.07% |
States/UTs with Lowest Inflation
| State/UT | Overall Inflation |
| Mizoram | 2.85% |
| Andaman and Nicobar Islands | 3.46% |
| Delhi | 3.80% |
| Meghalaya | 3.63% |
| Nagaland | 3.66% |
Note: The states with lowest inflation are shown in order of inflation, not alphabetical or geographical order. Meghalaya and Nagaland also saw low inflation.
This numbers were noted by the official MoSPI release for the October 2026. Be mindful when looking at the indices for each item at a state level as they’re based on a small sample size of price quotations.
How CPI Data is Collected
The Field Operations Division of the National Statistics Office (NSO) under the MoSPI collects retail price data.
For October 2026, they collected data from,
- 1,407 urban areas (including online areas).
- 1,465 villages across all states and UTs.
- They had a response rate of 100% from both rural and urban areas.
- The next CPI data will be released on 14th December 2026 for November 2026.
The CPI data released for October 2026 are provisional. The indices for each item and state can be found on the Ministry’s eSankhyiki portal.





 Net Direct Tax Collections Rise 11.8% to...
 Moody’s Raises India’s FY27 Growth F...
 PLFS Quarterly Bulletin July–September...