
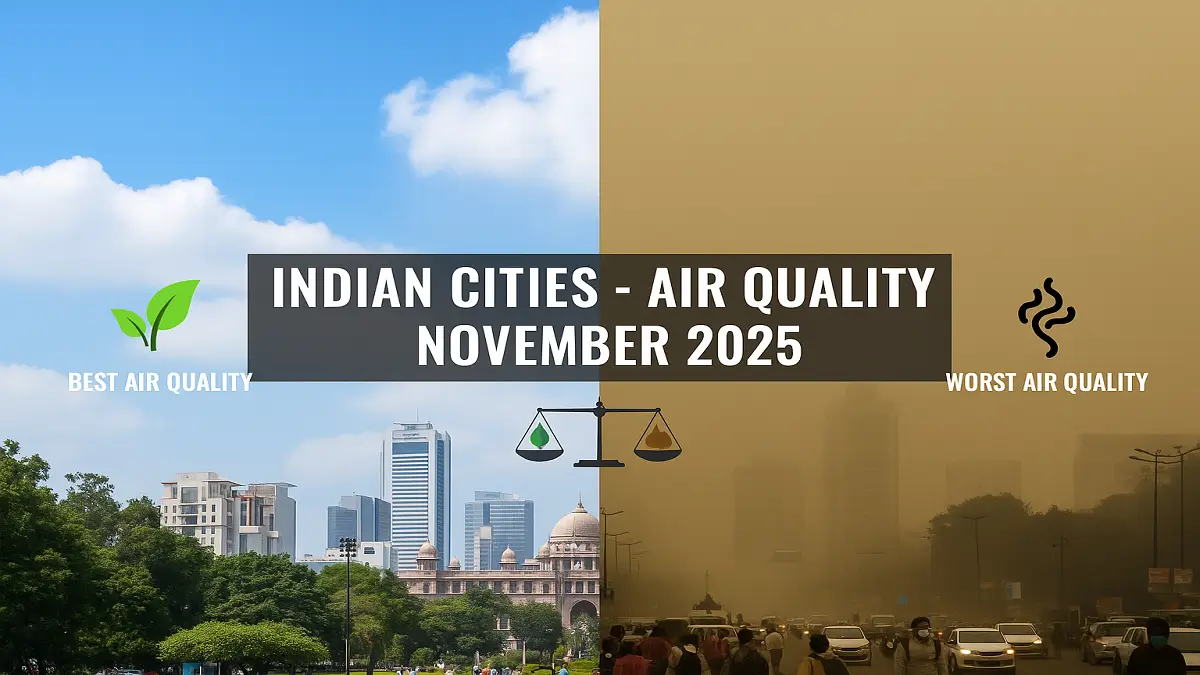
As winter sets in, India’s air pollution problem has returned with alarming severity—particularly in North India. Low wind speeds, falling temperatures, and increased emissions have pushed the Air Quality Index (AQI) of several major cities into the ‘very poor’ or ‘severe’ category.
According to the Central Pollution Control Board (CPCB) and data from IQAir Live AQI⁺ Rankings, New Delhi continues to hold the grim title of the world’s most polluted capital city, as of November 25, 2025.
Understanding AQI Levels
| AQI Range | Air Quality Category | Health Implication |
|---|---|---|
| 0–50 | Good | Minimal impact |
| 51–100 | Satisfactory | Minor breathing discomfort |
| 101–200 | Moderately Polluted | Discomfort to sensitive individuals |
| 201–300 | Poor | Breathing discomfort on prolonged exposure |
| 301–400 | Very Poor | Respiratory illness on prolonged exposure |
| 401–500 | Severe | Serious health impacts; emergency conditions |
Top 10 Indian Cities With Worst AQI (Most Polluted) – November 2025
The National Capital Region (NCR) dominates this list, with cities in Uttar Pradesh and Haryana recording dangerously high pollution levels.
| Rank | City | State | AQI | Category | Major Pollutants |
|---|---|---|---|---|---|
| 1 | Hapur | Uttar Pradesh | 416 | Severe | PM2.5 |
| 2 | Noida | Uttar Pradesh | 397 | Very Poor | PM10, PM2.5 |
| 3 | Ghaziabad | Uttar Pradesh | 396 | Very Poor | PM10, PM2.5 |
| 4 | Delhi (NCT) | Delhi | 382 | Very Poor | PM2.5 |
| 5 | Greater Noida | Uttar Pradesh | 382 | Very Poor | PM2.5 |
| 6 | Charkhi Dadri | Haryana | 366 | Very Poor | PM2.5 |
| 7 | Bulandshahr | Uttar Pradesh | 356 | Very Poor | PM2.5 |
| 8 | Meerut | Uttar Pradesh | 350 | Very Poor | PM10, PM2.5 |
| 9 | Manesar | Haryana | 342 | Very Poor | PM2.5 |
| 10 | Baghpat | Uttar Pradesh | 330 | Very Poor | PM2.5 |
Top 10 Indian Cities With Best AQI (Cleanest) – November 2025
In sharp contrast, Southern and Northeastern states have shown remarkable air quality. Tamil Nadu dominates the list with clean, breathable air in 8 out of 10 cities.
| Rank | City | State | AQI | Category | Main Pollutant |
|---|---|---|---|---|---|
| 1 | Ariyalur | Tamil Nadu | 13 | Good | SO₂ |
| 2 | Ooty | Tamil Nadu | 15 | Good | SO₂ |
| 3 | Karur | Tamil Nadu | 16 | Good | SO₂ |
| 3 | Tiruchirappalli | Tamil Nadu | 16 | Good | SO₂ |
| 4 | Thanjavur | Tamil Nadu | 17 | Good | SO₂ |
| 5 | Shillong | Meghalaya | 17 | Good | PM10 |
| 6 | Perundurai | Tamil Nadu | 21 | Good | PM10 |
| 7 | Tirupur | Tamil Nadu | 22 | Good | CO |
| 8 | Salem | Tamil Nadu | 22 | Good | PM2.5 |
| 9 | Mangalore | Karnataka | 25 | Good | O₃ |
| 10 | Davanagere | Karnataka | 26 | Good | CO |
Why Is Northern India So Polluted?
Several factors contribute to the North’s pollution crisis:
- Crop residue burning in Punjab and Haryana
- Vehicular emissions in densely populated cities
- Construction dust and industrial smoke
- Low wind speeds and temperature inversion trap pollutants
- Firecracker use during festival season (Diwali)
Why Southern and Northeastern Cities Are Cleaner
- Less industrialization and population density
- Effective implementation of pollution norms
- Abundant green cover and favorable geography
- Limited use of fossil fuels for domestic purposes

 Top-10 Largest Oil Consuming Countries i...
 What is the National Fruit of Malaysia? ...
 What is the Difference Between LPG and P...