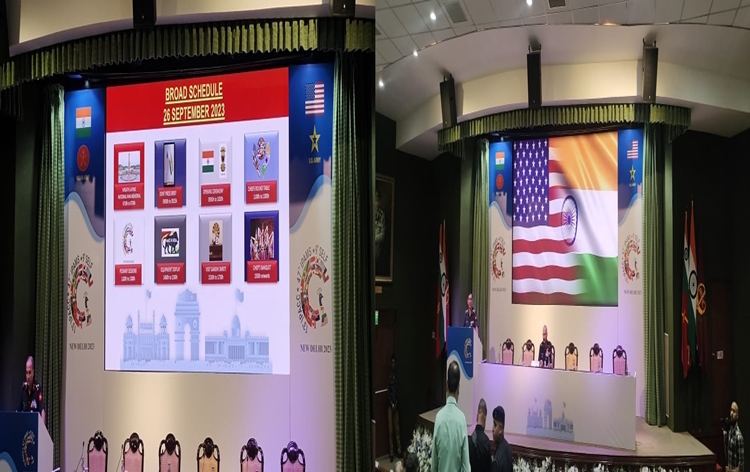
The Economic Survey 2025–26 is an important annual document that shows the real picture of India’s economy. Prepared under the guidance of Chief Economic Advisor Dr. V. Anantha Nageswaran, it reviews economic performance in 2025–26 and gives a roadmap for future growth. The Survey highlights key trends in GDP growth, inflation, employment, fiscal health, and sector-wise performance, while also explaining challenges and opportunities for India’s development in the coming years.
KEY HIGHLIGHTS AT A GLANCE
- GDP Growth: Real GDP growth projected at 7.4% and GVA growth at 7.3% for FY26
- Future Projections: Potential growth estimated at ~7%; FY27 GDP growth projected at 6.8-7.2%
- Inflation: Averaged historic low of 1.7% for April-December 2025
- Forex Reserves: USD 701.4 billion as of January 16, 2026 (11 months import cover, 94% of external debt)
- Services Exports: All-time high of USD 387.6 billion in FY25 (13.6% growth)
- Banking Health: GNPAs at multi-decadal low of 2.2% in September 2025
- Financial Inclusion: 55.02 crore bank accounts under PMJDY; 12 crore unique investors (25% women)
- Credit Ratings: Three sovereign upgrades in 2025 (Morningstar DBRS, S&P Global, R&I Inc.)
1. STATE OF THE ECONOMY
Global Context
- Global environment remains fragile despite better-than-expected growth
- Elevated risks from geopolitical tensions, trade fragmentation, financial vulnerabilities
- Impacts may surface with a lag
India’s Performance – Fastest Growing Major Economy (4th Consecutive Year)
- Real GDP Growth: 7.4% (FY26)
- GVA Growth: 7.3% (FY26)
Consumption Demand
- Private Consumption: 7.0% growth, reaching 61.5% of GDP (highest since 2012)
- Supported by:
- Low inflation
- Stable employment
- Increasing real purchasing power
- Rural consumption: Bolstered by strong agricultural performance
- Urban consumption: Improved through tax rationalization
Investment Activity
- Gross Fixed Capital Formation: 7.8% growth, maintaining 30% share of GDP
- Driven by:
-
- Sustained public capital expenditure
- Revival in private investment (evident from corporate announcements)
Supply Side Dynamics
- Services remain main growth driver
- Services GVA: 9.3% growth in H1 FY26; 9.1% estimated for full year
- Indicates broad-based sectoral expansion
2. FISCAL DEVELOPMENTS: ANCHORING STABILITY THROUGH CREDIBLE CONSOLIDATION
Credit Rating Upgrades
- Three sovereign credit rating upgrades in 2025:
- Morningstar DBRS
- S&P Global Ratings
- Rating and Investment Information (R&I), Inc.
Revenue Performance
- Centre’s revenue receipts: Rose to 9.2% of GDP in FY25 (PA)
- Up from average ~8.5% in FY16-FY20
- Non-corporate tax collections: Increased from ~2.4% to ~3.3% of GDP post-pandemic
Tax Base Expansion
- Income tax returns filed:
- FY22: 6.9 crore
- FY25: 9.2 crore
- Reflects improved compliance, technology adoption, growing tax base
GST Performance
- Gross GST collections (April-December 2025): ₹17.4 lakh crore (6.7% YoY growth)
- Aligned with nominal GDP growth
- E-way bill volumes: 21% YoY growth (April-December 2025)
Capital Expenditure
- Central government effective capex:
- Pre-pandemic average: 2.7% of GDP
- Post-pandemic: ~3.9% of GDP
- FY25: 4% of GDP
- State capex: Maintained at ~2.4% of GDP through SASCI scheme
Fiscal Deficit
- State governments: 3.2% of GDP in FY25 (reflecting emerging pressures)
- Debt reduction: General government debt-to-GDP ratio down 7.1 percentage points since 2020
3. MONETARY MANAGEMENT AND FINANCIAL INTERMEDIATION
Banking Sector Performance
Asset Quality – Multi-Decadal Achievement
- GNPA ratio: 2.2% (September 2025) – multi-decadal low
- Net NPA ratio: 0.5% (September 2025) – record low
- Credit growth: 14.5% YoY (December 2025) vs 11.2% (December 2024)
Financial Inclusion Initiatives
Pradhan Mantri Jan Dhan Yojana (PMJDY)
- Total accounts: 55.02 crore (as of March 2025)
- Rural/semi-urban: 36.63 crore accounts
- Established foundational infrastructure for previously unbanked populations
Other Schemes
- Stand-Up India: ₹10 lakh to ₹1 crore loans for SC/ST/women entrepreneurs
- PM SVANidhi: Collateral-free working capital for street vendors
- PM Mudra Yojana: ₹36.18 lakh crore disbursed across 55.45 crore accounts (till October 2025)
Capital Markets Expansion
Investor Participation
- Demat accounts: 235 lakh added in FY26 (till December); total 21.6+ crore
- Unique investors: Crossed 12 crore mark (September 2025); Nearly 25% are women
- Mutual fund investors: 5.9 crore unique investors; 3.5 crore from non-tier I & II cities (November 2025)
Infrastructure Development
- GIFT City: India’s first international financial services centre
International Validation – FSAP 2025
IMF-World Bank Assessment Highlights
- Resilient, diversified, inclusive financial system
- Total financial sector assets: 187% of GDP (CY 2024)
- Capital markets: Expanded from 144% (CY 2017) to 175% of GDP (CY 2024)
- Banks and NBFCs have adequate capital buffers under severe stress scenarios
4. EXTERNAL SECTOR: PLAYING THE LONG GAME
Export Performance – Record Growth
Merchandise Exports
- India’s global share nearly doubled: 1% (2005) to 1.8% (2024)
- Non-petroleum exports: Historic high of USD 374.3 billion (FY25)
- Non-petroleum, non-gems/jewellery: ~80% of aggregate exports
Services Exports – All-Time High
- USD 387.6 billion in FY25 (13.6% growth)
- India’s share in global services: 2% (2005) to 4.3% (2024)
- Reinforces position as global tech and business services hub
Total Exports
- USD 825.3 billion in FY25 (6.1% YoY growth)
Trade Diversification
- UNCTAD 2025: India ranked 3rd in Global South for trade partner diversification
- Trade diversity score higher than all Global North economies
Current Account Management
- CAD: ~1.3% of GDP (Q2 FY26) – favorable vs major economies
- Supported by:
- Strong services exports
- Robust remittances offsetting merchandise deficit
Remittances – World’s Largest Recipient
- USD 135.4 billion in FY25
- Increased share from advanced economies (skilled/professional workers)
Foreign Exchange Reserves – Strong Buffer
- USD 701.4 billion (as of January 16, 2026)
- Import cover: ~11 months
- External debt coverage: 94%
Foreign Direct Investment
- Gross FDI inflows: USD 64.7 billion (April-November 2025)
- Global rankings:
- 4th in Greenfield investment announcements (2024) – 1,000+ projects
- Largest destination for Greenfield digital investments (2020-24)
5. INFLATION: TAMED AND ANCHORED
Historic Low Achievement
- Average headline inflation (April-Dec 2025): 1.7%; Lowest since CPI series began
- Among sharpest declines in EMDEs: 1.8 percentage points drop (2025 vs 2024)
Key Drivers
- Disinflationary trend in food and fuel prices (52.7% of CPI basket)
6. AGRICULTURE AND FOOD MANAGEMENT
Sectoral Growth Performance
Livestock Sector
- GVA rose ~195% between FY15-FY24
Fisheries
- Fish production increased 140% (2014-2024) vs previous decade
Foodgrain Production – Record Output
- 3,577.3 lakh metric tonnes (AY 2024-25)
- Increase: 254.3 LMT over previous year
- Driven by higher output of rice, wheat, maize, coarse cereals
Horticulture – Key Growth Driver
- 33% of agricultural GVA
- Production: 362.08 million tonnes (2024-25)
- Exceeded foodgrain production (357.73 MT)
Agricultural Infrastructure
Marketing & Price Discovery
- e-NAM Scheme (as of December 31, 2025):
- 1.79 crore farmers
- 2.72 crore traders
- 4,698 FPOs
- 1,522 mandis across 23 States/4 UTs
Infrastructure Development
- Agriculture Marketing Infrastructure (AMI) sub-scheme
- Agriculture Infrastructure Fund (AIF)
Farmer Support Schemes
PM-KISAN
- ₹4.09 lakh crore released since inception (21 instalments)
- Assured MSP for mandated crops
PM Kisan Maandhan Yojana (PMKMY)
- 24.92 lakh farmers enrolled (December 31, 2025)
- Provides pension support
Rural Employment Transformation
- Viksit Bharat-GRAMG: Comprehensive statutory overhaul of MGNREGS; Aligns rural employment with Viksit Bharat 2047 vision
7. SERVICES: FROM STABILITY TO NEW FRONTIERS
Dominant Economic Role
- Share in GDP: 53.6% (H1 FY26)
- Share in GVA: 56.4% (FAE FY26) – highest ever
- Reflects rising weight of modern, tradable, digitally delivered services
Global Position
- 7th largest services exporter globally
- Global services share doubled: 2% (2005) to 4.3% (2024)
FDI Magnet
- Largest FDI recipient sector
- Average 80.2% of total FDI (FY23-FY25); Up from 77.7% pre-pandemic (FY16-FY20)
8. INDUSTRY: STRUCTURAL TRANSFORMATION AND GLOBAL INTEGRATION
Industrial Performance
- Industry GVA growth: 7.0% in H1 FY26 (real terms)
- Despite subdued global headwinds
Manufacturing – Structural Recovery
- Q1 FY26: 7.72% GVA growth
- Q2 FY26: 9.13% GVA growth
Production Linked Incentive (PLI) Schemes – Transformative Impact
14 Sectors – Unprecedented Success
- Actual investment: ₹2.0+ lakh crore
- Incremental production/sales: ₹18.7+ lakh crore
- Jobs created: 12.6+ lakh (as of September 2025)
Innovation Performance
- Global Innovation Index: Improved to 38th (2025) from 66th (2019)
Semiconductor Mission – Strategic Capability Building
- 10 projects approved across 6 States
- Investment: ~₹1.60 lakh crore
- Manufacturing and packaging capabilities
9. INVESTMENT AND INFRASTRUCTURE: CONNECTIVITY, CAPACITY, COMPETITIVENESS
Government Capital Expenditure – 4.2x Increase
- FY18: ₹2.63 lakh crore
- FY26 (BE): ₹11.21 lakh crore
- Effective capex FY26 (BE): ₹15.48 lakh crore
Transport Infrastructure
National Highways – 60% Network Expansion
- FY14: 91,287 km
- FY26 (up to December): 1,46,572 km
- High-Speed Corridors: 10x increase; FY14: 550 km; FY26: 5,364 km
Railways – Extensive Modernization
- Network: 69,439 route km (March 2025)
- FY26 addition target: 3,500 km
- Electrification: 99.1% (October 2025)
Aviation – World’s 3rd Largest Domestic Market
- Airports: 74 (2014) → 164 (2025)
Power Sector – Historic Turnaround
Capacity Expansion
- Installed capacity: 509.74 GW (November 2025) – 11.6% YoY growth
- Demand-supply gap: 4.2% (FY14) → Nil (November 2025)
DISCOM Transformation – First-Ever Profitability
- PAT: ₹2,701 crore (FY25) – historic positive turnaround
- AT&C losses: 22.62% (FY14) → 15.04% (FY25)
Renewable Energy Leadership
- 49.83% of total generation capacity (November 2025)
- Global ranking: 3rd in overall RE and installed solar capacity
Digital Infrastructure
- Tele-density: 86.76%
- 5G coverage: 99.9% of districts
Water Security
- Jal Jeevan Mission: 81%+ rural households have clean tap water access (October 2025)
Space Infrastructure – Elite Global Club
- 4th nation to achieve autonomous satellite docking (SpaDeX)
- Expanded indigenous missions
- Increased private-sector participation
10. ENVIRONMENT AND CLIMATE CHANGE
Renewable Energy Installation (2025-26, up to December 31)
Total: 38.61 GW
- Solar: 30.16 GW
- Wind: 4.47 GW
- Bio-Power: 0.03 GW
- Hydro: 3.24 GW
11. EDUCATION AND HEALTH: ACHIEVEMENTS AND TRANSFORMATION
School Education – World’s Largest System
Scale
- Students: 24.69 crore
- Schools: 14.71 lakh
- Teachers: 1.01+ crore (UDISE+ 2024-25)
Gross Enrolment Ratio (GER)
- Primary (I-V): 90.9
- Upper Primary (VI-VIII): 90.3
- Secondary (IX-X): 78.7
- Higher Secondary (XI-XII): 58.4
Key Schemes
- Poshan Shakti Nirman
- Samagra Shiksha Abhiyan
Higher Education – Massive Expansion
Institutional Growth
- HEIs: 51,534 (2014-15) → 70,018 (June 2025)
Premier Institutions (2014-15 to 2024-25)
- IITs: 23
- IIMs: 21
- AIIMS: 20
- International IIT campuses: 2 (Zanzibar, Abu Dhabi)
NEP Reforms – Implementation Progress
- National Credit Framework (NCrF): 170 universities adopted
- Academic Bank of Credit:
- 2,660 institutions
- 4.6+ crore IDs issued
- 2.2 crore APAAR IDs with credits
- Flexible entry-exit pathways: 153 universities
- Target: 50% GER by 2035
Health – Outpacing Global Averages
Maternal & Child Mortality Reduction (1990-2023)
- Maternal Mortality Rate (MMR): 86% reduction; Global average: 48%
- Under-Five Mortality (U5MR): 78% decline; Global: 61%
- Neonatal Mortality (NMR): 70% decline; Global: 54%
Infant Mortality Rate (IMR) – Decade of Progress
- 2013: 40 deaths per 1,000 live births
- 2023: 25 deaths per 1,000 live births
- 37% reduction
12. EMPLOYMENT AND SKILL DEVELOPMENT
Employment Statistics
Total Employment
- 56.2 crore people employed (aged 15+) in Q2 FY26
- New jobs: 8.7 lakh created in Q2 vs Q1 FY26
Manufacturing Sector (ASI FY24)
- 6% YoY employment increase
- 10+ lakh jobs added (FY24 vs FY23)
Worker Registration & Rights
e-Shram Portal – Massive Formalisation
- 31+ crore unorganised workers registered (January 2026)
- Women: 54% of total registrants
- Strengthens gender-focused welfare schemes
Labour Codes
- Formal recognition of gig and platform workers
- Expanded social security, welfare funds, benefit portability
Job Matching Platform
National Career Service (NCS)
- 59 million registered job seekers
- 5.3 million job providers
- Vacancies mobilised: FY25: 2.8+ crore; FY26 (by September): 2.3+ crore
Skill Development
National Scheme for Upgradation of ITIs
- Target: Upgrade 1,000 government ITIs
- 200 hub ITIs
- 800 spoke ITIs
- Features: Smart classrooms, modern labs, digital content, industry-aligned courses
13. RURAL DEVELOPMENT AND SOCIAL PROGRESS
Poverty Reduction – Dramatic Progress
World Bank Revised Poverty Line (USD 3.00/day, 2021 prices)
- 2022-23 rates:
- Extreme poverty: 5.3%
- Lower-middle-income poverty: 23.9%
NITI Aayog Multidimensional Poverty Index (MPI)
- 2005-06: 55.3%
- 2022-23: 11.28%
- Massive 44 percentage point reduction
Social Services Expenditure – Rising Commitment
- FY 2023-24: 7.0% of GDP
- FY 2024-25 (RE): 7.7% of GDP
- FY 2025-26 (BE): 7.9% of GDP
Rural Property Rights & Technology
SVAMITVA Scheme (December 2025)
- Drone survey completed: 3.28 lakh villages (of 3.44 lakh target)
- Property cards prepared: 2.76 crore for 1.82 lakh villages
Namo Drone Didi Scheme
- 1,094 drones distributed to SHG Drone Didis (2023-24)
- 500 under government scheme; remainder by Lead Fertiliser Companies
14. EMERGING FRONTIERS
AI Ecosystem Evolution
- Focus on smaller, task-specific models for diverse economic landscape
- Demand driven by real-world problems (healthcare, agriculture, urban management, education, disaster preparedness, public administration)
- Emphasis on local hardware compatibility and low-resource settings
Urbanisation & Regional Connectivity
- Namo Bharat Regional Rapid Transit System
- Reshapes urban/peri-urban labour markets
- Expands job access
- Supports polycentric growth
- Eases pressure on core metros
Strategic Economic Vision – From Swadeshi to Global Indispensability
Three-Tiered Framework
- Critical vulnerabilities – High strategic urgency
- Economically feasible capabilities – Strategic payoffs
- Low strategic urgency – High-cost substitution awareness
National Input Cost Reduction Strategy
- Treats competitiveness as infrastructure
- Ensures affordable, reliable inputs
Progressive Vision
- Swadeshi → Strategic Resilience → Strategic Indispensability
- Goal: World moves from “thinking about buying Indian” to “buying Indian without thinking”


What Drove India’s Industrial Production...
Economic Survey 2026: Release Date, Sign...
What Makes Nirmala Sitharaman's Ninth Bu...

