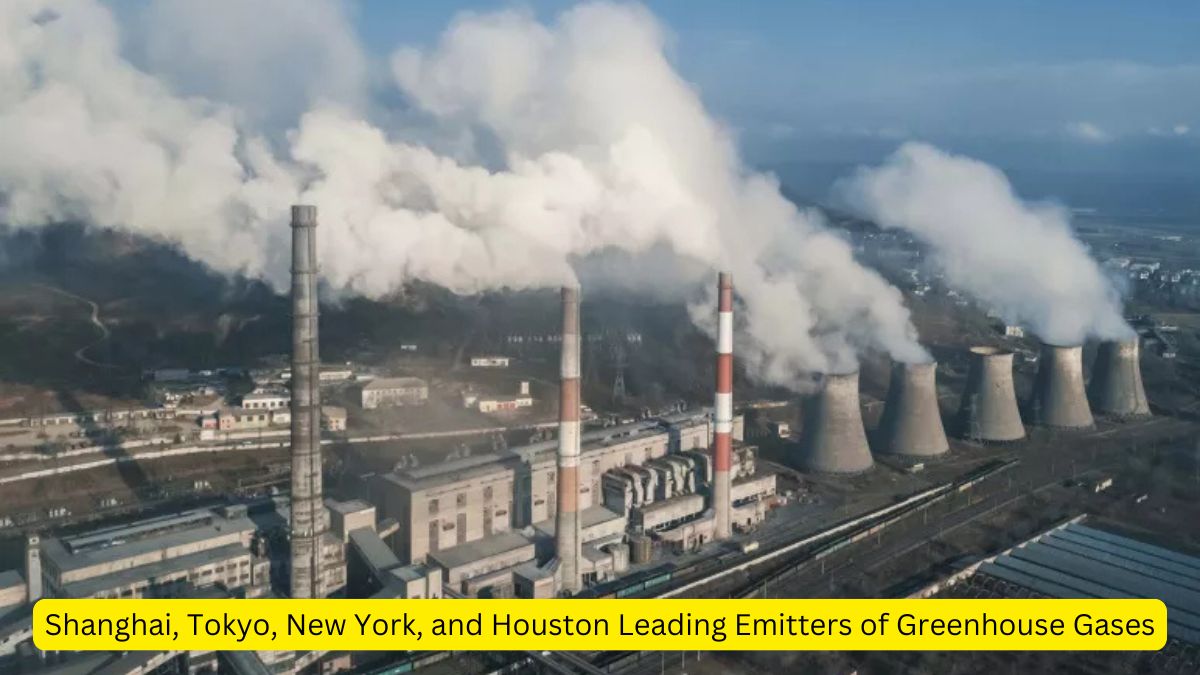
A new dataset released at the United Nations climate talks reveals that cities in Asia and the United States are the largest contributors to greenhouse gas emissions. Shanghai tops the list of polluting cities, followed closely by Tokyo, New York, and Houston. The data, compiled by Climate Trace using advanced observations and artificial intelligence, highlights the urgent need for global action to combat climate change.
Key Findings on Greenhouse Gas Emissions
Top Polluting Cities
- Shanghai: Emits 256 million metric tons of greenhouse gasses, more than countries like Colombia or Norway.
- Tokyo: Releases 250 million metric tons, ranking it among the top 40 emitters globally if it were a country.
- New York City: Emits 160 million metric tons, placing it in the top 50 of global emitters.
- Houston: Produces 150 million metric tons, also ranking in the global top 50.
- Seoul, South Korea: Fifth among cities with 142 million metric tons.
Global Trends in Emissions
- Earth’s total greenhouse gas emissions rose to 61.2 billion metric tons in 2023, a 0.7% increase from the previous year.
- Methane emissions increased by 0.2%; although short-lived, it has a potent heat-trapping effect.
Regional Highlights
- Provinces with Highest Emissions: Seven states or provinces emit over 1 billion metric tons each; six are in China, with Texas ranking sixth.
- Permian Basin, Texas: Identified as the world’s worst individual polluting site.
Country-Specific Data
- Biggest Emission Increases: China, India, Iran, Indonesia, and Russia saw the largest growth in emissions from 2022 to 2023.
- Biggest Decreases: Venezuela, Japan, Germany, the United Kingdom, and the United States recorded significant drops in pollution levels.
Other Pollutants
- Climate Trace also tracked traditional pollutants like carbon monoxide, sulfur dioxide, ammonia, and volatile organic compounds.
- Burning fossil fuels releases both greenhouse gasses and air pollutants, contributing to climate change and health risks.
| Summary/Static | Details |
| Why in the news? | Shanghai Tokyo New York Houston spew most greenhouse gas of world cities |
| Top Polluting Cities | – Shanghai: 256 million metric tons, more than Colombia or Norway.
– Tokyo: 250 million metric tons, comparable to top 40 nations. – New York City: 160 million metric tons, ranked in the global top 50. – Houston: 150 million metric tons, also in the top 50. – Seoul: 142 million metric tons, ranked fifth among cities. |
| Global Emissions | – Total emissions: 61.2 billion metric tons (2023), a 0.7% increase from 2022.
– Methane emissions: 0.2% increase, highly potent in trapping heat. |
| High-Emission Regions | – Seven states or provinces emit over 1 billion metric tons; six in China, one in Texas.
– Permian Basin, Texas: The worst individual polluting site globally. |
| Emission Trends | – Largest Increases: China, India, Iran, Indonesia, and Russia (2022–2023).
– Largest Decreases: Venezuela, Japan, Germany, the UK, and the U.S. |
| Other Pollutants | Tracks carbon monoxide, sulfur dioxide, ammonia, and volatile organic compounds associated with dirty air. |


 World Health Organization Prequalifies N...
 India Hosts First BRICS Sherpas Meeting ...
 Tarique Rahman Set to Lead Bangladesh? B...


