
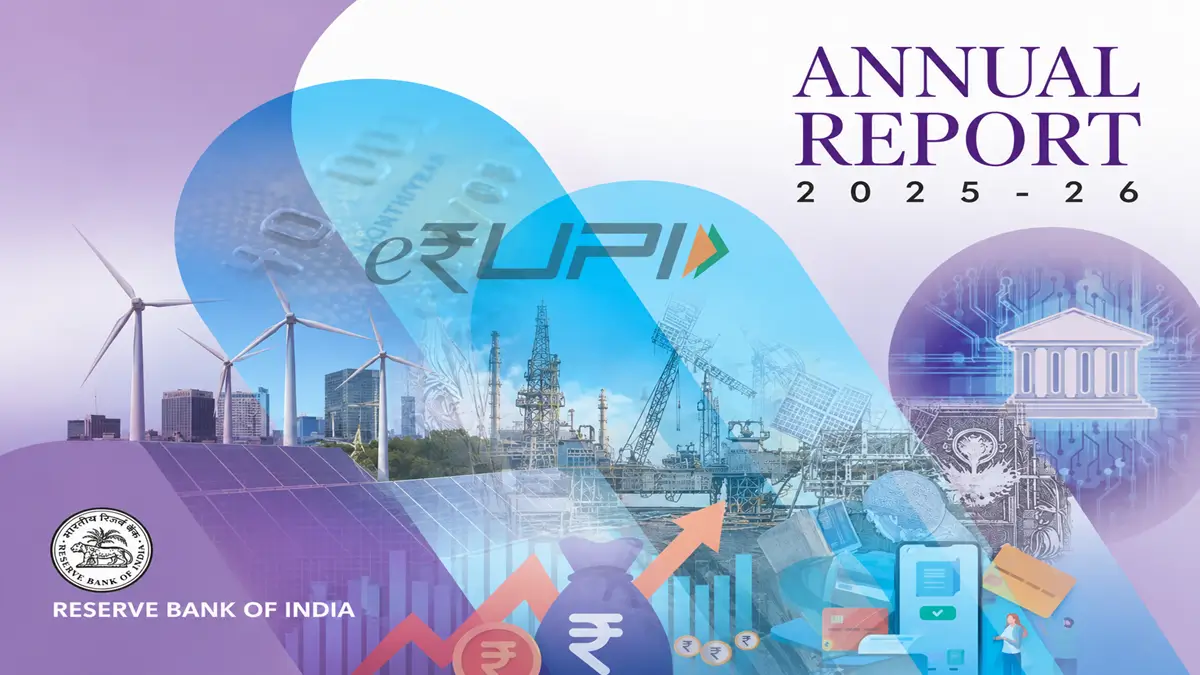
Reserve Bank of India released its Annual Report for 2025-26, a statutory report of its Central Board of Directors. The Report covers the working and functions of the Reserve Bank of India for the period April 2025 – March 2026.
Part One: The Economy — Review and Prospects
Chapter I: Assessment and Prospects
1. The Global Economy
- Growth and Revisions: Global growth registered at 3.4% in 2025 (up from 3.3% in 2024). Headwinds included high tariffs, elevated public debt, and trade policy uncertainty. Tailwinds included frontloading of imports, supply chain realignments, and artificial intelligence (AI)-related tech investments. Due to the West Asia conflict breaking out in end-February 2026, the International Monetary Fund (IMF) downgraded its 2026 global growth baseline forecast to 3.1%.
- Global Trade: World trade volume expanded by 5.1% in 2025. Merchandise trade grew by 4.6% due to tech inventory spikes, while global services trade moderated to 5.3% as post-pandemic travel leveled off. The IMF projects 2026 trade volume decelerating to 2.8%.
- Global Inflation: Global inflation cooled to 4.1% in 2025. Due to West Asian transit conflicts disrupting supply chains, the IMF raised its 2026 global inflation forecast to 4.4%.
2. The Domestic Economy
- GDP Performance: India remained the fastest-growing major economy, with real GDP expanding at 7.6% in 2025-26, up from 7.1% in 2024-25. Growth was supported by strong domestic consumption and sustained fixed investment.
- Growth Projections (2026-27): Real GDP growth for 2026-27 is projected at 6.9%, with risks tilted to the downside due to external logistics and energy price hikes.
- Headline Inflation: Headline CPI inflation moderated sharply to 2.1% in 2025-26 from 4.6% in the previous fiscal year, driven by a deflation in food prices. For 2026-27, CPI inflation is projected at 4.6% with risks tilted to the upside.
Chapter II: Economic Review
1. The Real Economy
Demand-Side Components
- Private Consumption: Private Final Consumption Expenditure (PFCE) remains the mainstay of aggregate demand, accelerating to 7.7% in 2025-26 from 5.8% a year ago, boosted by steady rural and urban demand.
- Fixed Investment: Gross Fixed Capital Formation (GFCF) expanded at a robust 7.1% rate. The gross domestic investment rate remained stable at 34.3% of GDP in 2024-25.
- Savings Framework: Gross domestic savings rose to 34.2% of Gross National Disposable Income (GNDI) in 2024-25. Net household financial savings increased to 7.0% of GNDI. General government dissaving contracted to 4.6% of GDP from 5.3%. This overall narrowing of the saving-investment gap reduced structural dependence on volatile external capital flows.
Supply-Side Components
- Agriculture & Allied Activities: Decelerated to 2.4% in 2025-26 from 4.2% a year ago due to weather-related shocks to Kharif crops. However, a favorable South-West monsoon replenished storage reservoirs to an all-time high of 91.4% in October 2025, lifting Rabi and summer (Zaid) crop output. Public foodgrain stocks at the Food Corporation of India (FCI) ended end-March 2026 at more than four times the mandatory buffer norms.
- Industrial Sector: Recorded a real GVA expansion of 9.5% in 2025-26, up from 8.7%. Manufacturing led the charge with a robust growth rate of 11.5%. Manufacturing capacity utilization sequentially expanded to 75.6% by Q3:2025-26.
- Green and Clean Transition: India surpassed 250 GW of installed renewable energy capacity. Total non-fossil capacity reached 283 GW (53.2% of the overall power mix), achieving the COP26 target well ahead of the 2030 schedule. Electric vehicle (EV) sales crossed 25 lakh units under the PM E-DRIVE scheme.
- Services Sector: Contributed 69% of real GVA growth, expanding by 8.7% in 2025-26. Growth was led by trade, transport, hotels, and professional financial/IT services.
2. Price Situation
The Macro-Consumer Price Index Framework
- Structural Rebasing: In February 2026, MoSPI released a rebased CPI series (Base Year 2024=100). It updates consumption patterns via the Household Consumption Expenditure Survey (HCES) 2023-24.
- Weight Realignment: The weight of ‘Food and Beverages’ was reduced from 45.9% to 36.8%. Prepared meals were reclassified under ‘Restaurants and accommodation services’. A unified ‘Housing, water, electricity, gas and other fuels’ division was formed (17.7% weight). ‘Transport’ (8.8% weight) and ‘Information and communication’ (3.6% weight) were separated.
Inflation Dynamics and Component Drivers
- Food Deflation: Food and beverages contracted by -0.8% during April–December 2025. Tomato, Onion, and Potato (TOP) items fell into a steep 31.3% deflation due to a 26.7% surge in domestic onion production and buffer stock operations. Pulses also shifted into deflation, dropping 13%. Conversely, oils and fats inflation expanded into double digits (15.0%), driven by international palm oil bio-diesel mandates.
- Fuel Trends: Fuel inflation increased to 2.4% during April–December 2025 due to a ₹50 hike per domestic LPG cylinder in April 2025, followed by a ₹60 hike in March 2026.
- Core CPI Stickiness: Inflation excluding food and fuel hovered at 4.3% during April–December 2025. Under the 2024 rebased series, it averaged 3.7% in Q4. Core pressures were driven by personal care items, specifically gold and silver precious metals, which spiked on global safe-haven demand.
- Other Metrics: Wholesale Price Index (WPI) inflation moderated to 0.7% in 2025-26 from 2.3% due to energy declines. The GDP deflator declined to 0.9% from 2.5%.
3. Money and Credit
Monetary Aggregates
- Reserve Money (RM): The Reserve Bank’s balance sheet stood at 26.4% of GDP. Adjusted for the staggered 100 bps reduction in the Cash Reserve Ratio (CRR) (which lowered the requirement to 3.0%), reserve money growth accelerated to 10.8%. Currency in Circulation (CiC) grew by 11.4%, driven by welfare payout disbursements and post-tax-cut retail spending.
- Broad Money ($M_3$): Broad money supply expanded by 13.0% in 2025-26, up from 9.4%. This was supported by a 10.6% growth in bank time deposits. The currency-deposit ratio dropped to 14.9%, while the money multiplier improved to 6.1.
Banking Credit Profile
- Credit Growth: Non-food bank credit grew by 15.9% in 2025-26. Credit from non-bank intermediate sources grew by 13.3%.
- Sectoral Deployments: Credit to Micro and Small enterprises expanded by 33.1%, and Medium enterprises by 21.7%. Personal loans grew at 16.2%, with housing loans making up nearly half of the personal segment. Bank loans to NBFCs grew by 26.3% after the RBI restored normalized risk weights in April 2025.
- Funding Mismatch: Credit expansion outpaced aggregate bank deposit growth. This caused a widening credit-deposit gap, prompting commercial banks to increase issuances of Certificates of Deposit (CDs) to bridge funding shortfalls.
4. Financial Markets
- Money Market Operations: The overnight Weighted Average Call Rate (WACR) tracked the repo rate corridor closely, averaging 7 bps below the policy repo rate. Collateralised transactions dominated, with triparty repos holding a 67% share and market repos at 30%.
- Yield Curve Behavior: G-sec yields softened in Q1 due to liquidity support, but hardened later in the year. The 10-year generic G-sec yield crossed the 7.04% mark in late March 2026, pushed up by rising crude oil prices and higher projected market borrowings.
- Equity Volatility: The BSE Sensex recorded a net annual decline of 7.1%, closing at 71,948. Strong performance in H1 was offset by H2 corrections due to West Asian tensions and tech valuation adjustments. Foreign Portfolio Investors (FPIs) were net equity sellers at ₹2.7 lakh crore, while Domestic Institutional Investors (DIIs) made net purchases of ₹8.5 lakh crore.
- Foreign Exchange Market: The Indian Rupee (INR) traded with a depreciating bias, closing the year lower by 9.9% at ₹94.83 per USD. The 40-currency Nominal Effective Exchange Rate (NEER) and Real Effective Exchange Rate (REER) depreciated by 6.9% and 7.5%, respectively.
5. Government Finances
- Deficit Containment: The Central Government reduced its Gross Fiscal Deficit (GFD) to 4.4% of GDP in 2025-26 (RE). This consolidation was driven by strong non-tax revenue gains and targeted spending curbs. The deficit target for 2026-27 (BE) is budgeted down to 4.3% of GDP.
- Revenue and Outlays: Direct taxes are budgeted at a decade-high 6.9% of GDP for 2026-27. Central capital expenditure is budgeted to expand by 11.5% to reach ₹12.2 lakh crore.
- State and Local Finances: States’ revenue receipts slowed due to lower central grants and moderating state GST (SGST) collections. However, their consolidated GFD-to-GSDP ratio is budgeted at 3.0% for 2026-27. Gross transfers to states are budgeted to rise by 12.2%.
- Sixteenth Finance Commission (FC-XVI): Preserved the vertical tax devolution share to states at 41%. It revised the horizontal criteria by assigning a 10% weight to “States’ contribution to GDP”. Income distance weight was lowered to 42.5%, population to 17.5%, and fiscal performance to 10%. Notably, the Commission discontinued post-devolution revenue deficit grants to eliminate perverse adjustments and boost internal state tax collection.
6. External Sector
- Current Account Deficit (CAD): The merchandise trade deficit widened to US$ 333.2 billion. However, net services exports grew by 15.3%, and private remittance transfers expanded by 10.1%, containing the CAD to 1.0% of GDP during April–December 2025.
- Trade Diversification Agreements: In response to trade shifts, China overtook the US to become India’s largest single trading partner in 2025-26. India finalized negotiations for a Free Trade Agreement (FTA) with the European Union, signed a Comprehensive Economic and Trade Agreement (CETA) with the UK, a CEPA with Oman, and an FTA with New Zealand.
- Capital Accounts & Adequacy: Net capital flows fell short of financing the current account gap, leading to a US$ 30.8 billion reserve depletion on a BoP basis (excluding valuation effects). Equity FPI flows pulled back by US$ 16.5 billion. Gross inward FDI rose to US$ 94.5 billion, resulting in net inward FDI of US$ 7.7 billion. Total foreign exchange reserves stood at US$ 691.1 billion at end-March 2026, maintaining 11 months of import cover and covering 90.3% of total external debt.
Part Two: The Working and Operations of the Reserve Bank of India
Chapter III: Monetary Policy Operations
1. Interest Rate Decisions
- Policy Rate Adjustments: The MPC cut the policy repo rate by 100 basis points to 5.25% across three key actions: a 25 bps cut in April 2025, a 50 bps cut in June 2025, and a 25 bps cut in December 2025.
- Monetary Policy Stance: Shifted from neutral to accommodative in April 2025, but reverted to neutral in June 2025 to retain policy flexibility against volatile fuel and commodity prices.
2. Liquidity Management Framework
- Liquidity Injections: The RBI infused durable liquidity via Open Market Operation (OMO) purchases, USD/INR buy/sell swaps, and a 100 bps cut to the Cash Reserve Ratio (CRR), which freed up approximately ₹2,50 crore in bank liquidity.
- Operational Streamlining: Following an Internal Working Group review, the RBI discontinued daily 14-day variable rate repo and reverse repo operations as its primary tools. Instead, frictional liquidity fluctuations are managed via 7-day and fine-tuning VRR/VRRR auctions. The Standing Deposit Facility (SDF) handled 84.9% of total daily LAF surplus absorptions.
3. Credit Transmission Efficiency
- Rate Pass-Through: In response to the 100 bps repo rate cut, SCBs lowered their 1-year median Marginal Cost of Funds-based Lending Rate (MCLR) by 60 bps. The Weighted Average Lending Rate (WALR) on fresh loans fell by 95 bps, and outstanding loans fell by 78 bps.
- External Benchmark Penetration: The share of EBLR-linked floating rate loans rose to 65.4% by December 2025. Private banks held a higher proportion of EBLR loans (89.2%) compared to public sector banks (50.6%), leading to faster rate pass-through among private lenders.
Chapter IV: Credit Delivery and Financial Inclusion
1. Priority Sector Lending (PSL)
- SCBs achieved a priority sector lending rate of 45.0% of Adjusted Net Bank Credit (ANBC), exceeding the statutory 40% threshold. Small Finance Banks led institutional achievements at 78.8% of ANBC.
- To support micro-enterprises, the RBI doubled the cap for collateral-free lending to Micro and Small Enterprises (MSEs) from ₹10 lakh to ₹20 lakh.
2. Financial Inclusion Metrics
- Index Performance: The RBI’s composite Financial Inclusion Index (FI-Index) improved to 67.0 in March 2025 from 64.2, driven by gains in the usage and quality sub-indices.
- Digital Ecosystem Expansion: The Expanding and Deepening of Digital Payment Ecosystem (EDDPE) initiative achieved 100% digital onboarding coverage in 710 districts (over 80% of districts nationwide). Basic Savings Bank Deposit Accounts (BSBDAs) reached 7,304 lakh accounts, with female account holders making up a 52% share.
3. National Strategy for Financial Inclusion (NSFI): 2025-30
The “Panch-Jyoti” Roadmap: Launched in December 2025, the strategy establishes a 47-point action plan structured across five core pillars:
- Improving availability and suitability of affordable financial services for households and micro-enterprises.
- Adopting gender-sensitive approaches for women-led financial inclusion and resilience.
- Synergising livelihood opportunities and skill development with formal financial systems.
- Leveraging financial education as a structural tool to build financial discipline.
- Strengthening customer protection and grievance redressal reliability.
Chapter V: Financial Markets and Foreign Exchange Management
1. Financial Markets Regulation (FMRD)
- Transaction Transparency: The RBI mandated the use of a Unique Transaction Identifier (UTI) for over-the-counter (OTC) derivative trades. This directive was consolidated into the Master Direction on Unique Identifiers in Financial Markets.
- Market Access Extensions: Municipal bonds were approved as eligible collateral for repo transactions. To encourage electronification, the RBI linked the FX-Retail platform with Bharat Connect and connected the NDS-OM platform directly with global bond trading networks. Additionally, the Fixed Income Money Market and Derivatives Association of India (FIMMDA) was formally recognized as an SRO.
2. Market Operations (FMOD)
-
The RBI executed target interventions across onshore and offshore OTC and exchange-traded currency derivative segments to manage extreme volatility in the USD/INR exchange rate. To limit speculative trades, Authorised Dealers were required to maintain their net open positions involving the Rupee (NOP-INR) within US$ 100 million by April 2026.
3. Foreign Exchange Management (FED) & INR Internationalisation
- Local Currency Arrangements (LCAs): To establish the Rupee as an international settlement option, the RBI finalized bilateral LCAs with 4 jurisdictions (UAE, Indonesia, Maldives, and Mauritius). Correspondent banks across 35 partner countries operationalized Special Rupee Vostro Accounts (SRVAs).
- Trade Invoicing Statistics: Total exports settled via INR reached ₹1,71,916 crore, while INR-settled imports grew to ₹1,59,691 crore.
- Lending in Local Currency: AD banks were permitted to lend in INR to non-resident entities in Nepal, Bhutan, and Sri Lanka to settle trade transactions, reducing reliance on central bank swap lines.
- Corporate and Credit Relief: The RBI eased export realization windows for goods sent to Bharat Mart in the UAE to nine months. It also extended the standard realization period for regular exports from 9 to 15 months to help businesses manage global trade headwinds. The ECB framework was updated to expand the eligible borrower base and link debt limits directly to a borrower’s financial position.
Chapter VI: Regulation, Supervision and Financial Stability
1. Department of Regulation (DoR)
-
Regulatory Consolidation: In a major compliance overhaul, the DoR consolidated over 11,000 individual circulars, updates, and instructions into 244 standardized Master Directions. These are organized across 30 distinct functional categories covering 11 types of regulated entities. To simplify procedures further, the department released 64 draft master directions for public review.
2. FinTech Department & Innovation Hub (RBIH)
- Direct Benefit Transfer Programmability: The RBI added programmability features to CBDC-Retail pilots, using them to disburse food subsidies under central and state DBT programs in Gujarat, Puducherry, and Chandigarh.
- Asset Tokenization Platforms: Developed the Unified Markets Interface (UMI), a multi-layer asset tokenization platform that uses wholesale CBDC to improve settlement efficiency. A pilot for tokenizing Certificates of Deposit (CDs) was launched on UMI.
- Unified Lending Interface (ULI): Scaled up by onboarding additional data providers and lenders to deliver end-to-end digital credit without friction.
- MuleHunter.ai™: Expanded across commercial banks, utilizing a supervised machine-learning model to detect and disable fraudulent mule accounts in near-real-time.
- AI Governance and Sovereign Tech: The RBI reviewed the FREE-AI (Framework for Responsible and Ethical Enablement of AI) Committee report to guide ethical AI integration within the financial sector. This aligns with the government’s launch of ‘Bharat Gen’, a state-funded multilingual and multimodal Large Language Model (LLM).
3. Department of Supervision (DoS) & Enforcement (EFD)
-
Cyber Security Mapping: The DoS launched the cyber range initiative to test and improve cyber resilience across commercial banks. It conducted sectoral KYC/AML risk assessments for NBFCs and upgraded supervisory analysis through micro-data analytics. For cooperative banking, the department developed a supervisory data quality index (sDQI) for Tier 3 and Tier 4 UCBs.
Chapter VII: Public Debt Management
1. Central Government Debt Management
-
The RBI managed gross market borrowings of ₹14.6 lakh crore for the Central Government in 2025-26. For 2026-27 (BE), gross market borrowings are budgeted at ₹17.2 lakh crore, with net market borrowings placed at ₹11.7 lakh crore (3.0% of GDP). Net market borrowings will fund 69.2% of the central fiscal deficit.
2. State Government Debt Management
-
The RBI managed market borrowing operations for state governments and union territories via State Government Securities (SGSs). The bank extended the Scheme for Special Assistance to States for Capital Investment, which provides 50-year interest-free loans, increasing the total allocation by 33.3% to ₹2 lakh crore.
Chapter VIII: Currency Management
1. Banknotes in Circulation
-
Currency in Circulation (CiC) grew by 11.4% in value during 2025-26, up from 5.8% in the previous year. This increase was driven by consumption cash demand following income tax cuts, agricultural damage compensation payouts, and direct cash transfers by state governments. Banknotes of ₹500 denomination held the largest share in terms of both total value and volume.
2. Currency Infrastructure and Security Printing
-
Industrial currency processing was optimized using Shredding and Briquetting Systems (SBS) and high-speed Currency Verification and Processing Systems (CVPS). Security printing costs were managed through production efficiencies at Bharatiya Reserve Bank Note Mudran Private Limited (BRBNMPL) presses. Coin distribution was supported by expanding the Mobile Coin Van (MCV) network, and updates were made to the Mobile Aided Note Identifier (MANI) app to assist visually impaired citizens.
Chapter IX: Payment and Settlement Systems and Information Technology
1. Retail Payment Performance
- UPI Scale: Unified Payments Interface (UPI) transaction volumes grew by 30%, surpassing 200 billion annual transactions.
- Digital Payments Index: The composite RBI-DPI grew by 11% in 2025-26, reflecting steady digital payment adoption across rural and semi-urban areas.
2. Payments Vision 2028
-
Strategic Pillars: Launched under the theme “Shaping India’s Payment Frontier”, the framework provides an operational roadmap through December 2028. Key initiatives include:
- Exploring full-scale implementation of the Digital Payments Intelligence Platform (DPIP) to fight cyber-enabled frauds.
- Introducing a centralized ‘switch-on’ and ‘switch-off’ utility tool for digital payment channels.
- Upgrading consumer protection guidelines to limit customer liability across alternative electronic bank fraud categories, and creating a compensation setup for low-value fraud victims.
Chapter X: Communication, International Relations, Research and Statistics
1. International Interoperability and Alliances
-
The RBI entered into bilateral digital asset partnerships with the Monetary Authority of Singapore (MAS) and held joint operational sessions with the Central Bank of the UAE (CBUAE) to link fast payment systems and test cross-border CBDC transactions. The bank also joined multilateral initiatives led by the BIS Innovation Hub, including Project Rialto and Phase 2 of Project Mandala, which focus on improving cross-border payment efficiency using CBDCs.
2. Statistical Architecture
-
Upgraded the Centralised Information Management System (CIMS) to utilize micro-data analytics. This upgrade improves macroeconomic forecasting and risk tracking while reducing manual reporting tasks for commercial banks.
Chapter XI: Governance, Human Resources and Organisational Management
1. Utkarsh 2029 Strategic Framework
-
The RBI launched Utkarsh 2029, its medium-term strategic framework for the period 2026-29. The strategy focuses on improving early risk detection, strengthening root-cause analysis, and standardizing supervisory actions across regulated financial entities. Technical training was consolidated under the Enterprise Computing and Cybersecurity Training Institute (ECCTI).
2. Corporate Governance Alignments
-
Internal governance processes were updated by streamlining the reporting requirements for commercial bank boards. This change allows bank boards to dedicate more time to institutional business strategy and risk governance matters.
Chapter XII: The Reserve Bank’s Accounts for 2025-26
1. Balance Sheet Compilations
-
The RBI’s total balance sheet size expanded, equivalent to 26.4% of India’s GDP as of March 31, 2026, up from 23.7% in the previous year.
2. Asset Structure and Surplus Transfers
-
Balance sheet expansion was driven by revaluation gains within Foreign Currency Assets (FCA) and gold holdings, resulting from exchange rate adjustments and rising international gold prices. Reflecting these valuation adjustments, gold’s share within the RBI’s Net Foreign Assets (NFA) rose to 17.2% from 12.0%. Net income gains supported a surplus transfer to the Central Government to reinforce macroeconomic stabilization reserves.





 NPCI Defers 0.4% MDR on Select UPI Trans...
 SEBI Credit Risk-o-Meter for Bonds: Six ...
 RBI Raises Daily CRR Maintenance Require...