
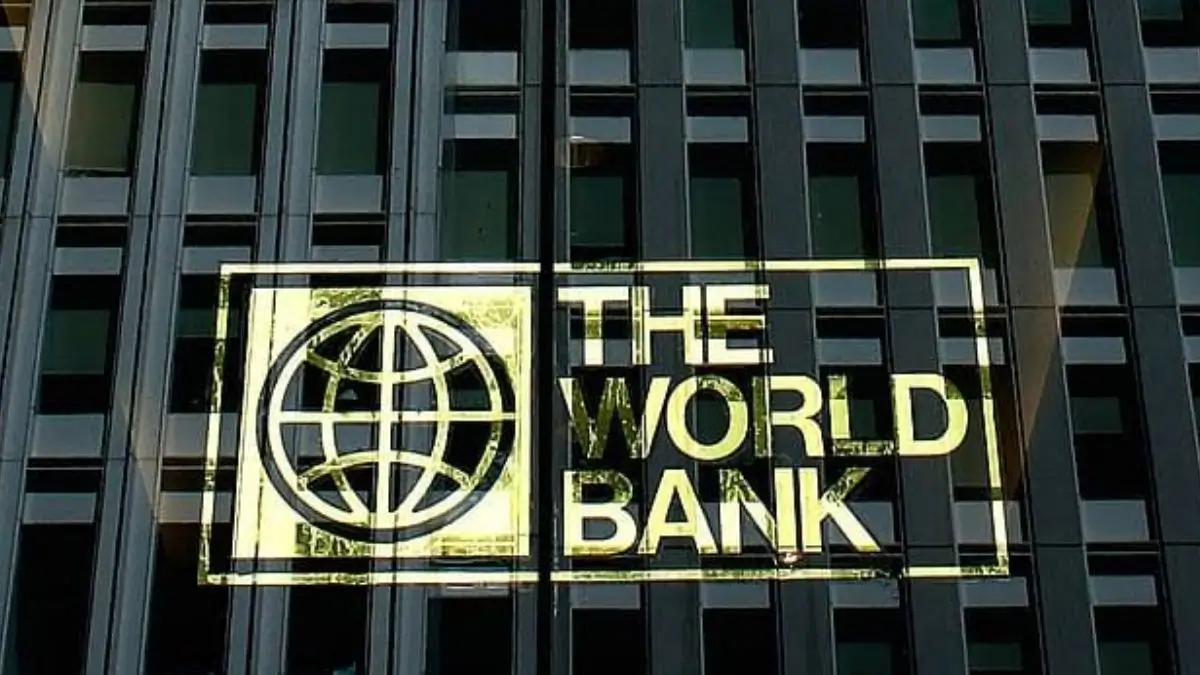
The number of people living in extreme poverty conditions in India decreased from 27.1% to 2.6% between 2011 and 2023, thereby taking out an estimated 496 million individuals out of extreme poverty as per the World Bank’s Poverty and Equity Brief for October 2026. The report underscores some positive developments in terms of household consumption, employment, and social protection. Yet, it also brings forth some challenges like regional disparities, youth unemployment, and poor-quality employment.
World Bank findings on Poverty Reduction in India for the 2011 to 2023 period
In the report given by the World Bank in October 2023 as Poverty and Equity Brief, it was observed that during the period from 2011 to 2023, there has been a substantial decrease in monetary poverty, especially in India.
The report states that during this period, there has been a drastic reduction in the percentage of the population living under extreme poverty from 27.1% to 2.6%. This means approximately 496 million people managed to move out of extreme poverty.
The report also calculated poverty with the help of the lower-middle-income poverty line of USD 4.20 per person per day, taking the basis of purchasing power parity from 2021.
The report suggests that poverty in India has decreased considerably, with the percentage of poor people in India has reduced from 57.7% to 16.1% during this time period.
| Poverty Type | 2011 | 2023 |
| Extreme poverty percentage | 27.1% | 2.6% |
| Poverty according to 4.2 dollars per day | 57.7% | 16.1% |
What Are the World Bank’s Poverty Lines?
The World Bank uses international poverty lines that allow comparisons of poverty levels in countries of varying economic levels and price structures.
World Bank’s international poverty lines are measured in terms of PPP dollars as compared to ordinary US dollars that are exchangeable against other currencies.
The poverty lines that are of interest in the context of this report are,
- $3.00 per day: International extreme poverty line.
- $4.20 per day: Poverty line for lower-middle-income countries.
- $8.30 per day: Poverty line for upper-middle-income countries.
These poverty lines are in relation to the 2021 PPP prices. The extreme poverty line measures the worst form of monetary poverty, while the others correspond to countries of varying income levels.
Facts behind the Reduction in Poverty Rate
Three key facts related to the reduction in India’s poverty rate were pointed out by the World Bank.
1. Rapid consumption growth
- High household consumption was one of the reasons that contributed to the better living standard and allowed citizens to raise their status above the poverty line.
2. Rise in the number of jobs
- There was an increase in jobs, with one of the important roles played by the employment of women in the workforce, especially in rural areas.
3. Development of social security system
- Social security systems provided assistance to vulnerable families in order to meet their consumption requirements.
Multidimensional Poverty in India
Poverty encompasses not just low income but also deprivation in other areas such as health, education and standards of living. Poverty is measured through the Multidimensional Poverty Index (MPI).
In its briefing, the World Bank highlighted the improvement in multidimensional poverty indicators in India.
| Measure | Period | Poverty rate |
| Oxford Poverty and Human Development Initiative (OPHI) Multidimensional Poverty Index | 2005–06 | 53.8% |
| OPHI Multidimensional Poverty Index | 2019–21 | 16.4% |
| World Bank multidimensional poverty measure | 2022–23 | 15.5% |
The OPHI numbers show that multidimensional poverty decreased significantly over the time period analyzed.
World Bank Poverty Forecasts for India: 2026-2028
The World Bank anticipates a gradual decline in poverty in India, albeit at a slower rate.
Using the USD 4.20-a-day threshold for lower-middle-income poverty, the projected poverty rates are,
| Year | Poverty rate |
| 2026 | 14.2% |
| 2028 | 12.1% |
This projection rests on microsimulations and may change when new labor-market and macroeconomic information becomes available.
These are forecasts rather than certain outcomes.







 US Federal Reserve Holds Interest Rates ...
 India’s Soybean Imports Hit Record 1.1...
 MoSPI to Start Annual Unincorporated Sec...